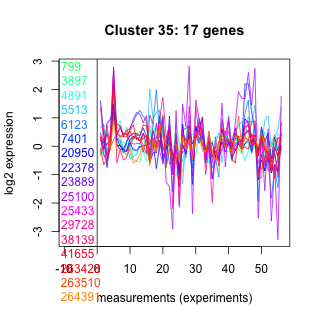
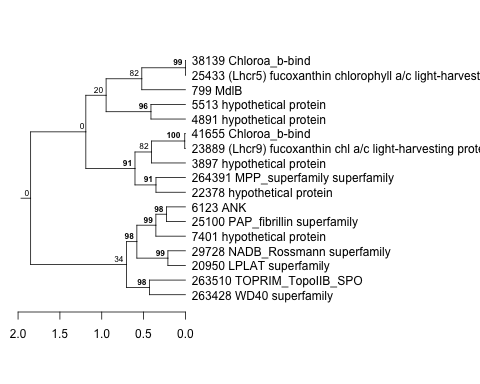
Thaps_hclust_0035 Hierarchical Clustering
Thalassiosira pseudonana
| Cluster Plot | Conditions Plot | Dendrogram |
|---|---|---|
 |
 |
 |
| GO ID | Go Term | p-value | q-value | Cluster |
|---|---|---|---|---|
| GO:0009765 | photosynthesis light harvesting | 0.00231429 | 1 | Thaps_hclust_0035 |
| GO:0009225 | nucleotide-sugar metabolism | 0.0166355 | 1 | Thaps_hclust_0035 |
| GO:0006265 | DNA topological change | 0.0184686 | 1 | Thaps_hclust_0035 |
| GO:0006508 | proteolysis | 0.0257707 | 1 | Thaps_hclust_0035 |
| GO:0006259 | DNA metabolism | 0.0257707 | 1 | Thaps_hclust_0035 |
| GO:0006470 | protein amino acid dephosphorylation | 0.0473882 | 1 | Thaps_hclust_0035 |
| GO:0005975 | carbohydrate metabolism | 0.131302 | 1 | Thaps_hclust_0035 |
| GO:0006810 | transport | 0.294845 | 1 | Thaps_hclust_0035 |
|
799 : MdlB |
7401 : hypothetical protein |
25100 : PAP_fibrillin superfamily |
41655 : Chloroa_b-bind |
|
3897 : hypothetical protein |
20950 : LPLAT superfamily |
25433 : (Lhcr5) fucoxanthin chlorophyll a/c light-harvesting protein |
263428 : WD40 superfamily |
|
4891 : hypothetical protein |
22378 : hypothetical protein |
29728 : NADB_Rossmann superfamily |
263510 : TOPRIM_TopoIIB_SPO |
|
5513 : hypothetical protein |
23889 : (Lhcr9) fucoxanthin chl a/c light-harvesting protein |
38139 : Chloroa_b-bind |
264391 : MPP_superfamily superfamily |
|
6123 : ANK |
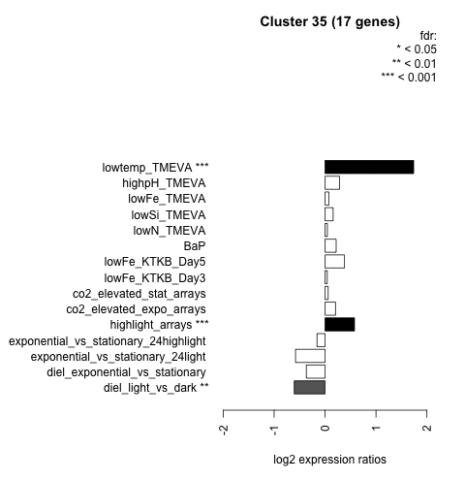
| Condition | Condition | Difference | FDR |
|---|---|---|---|
| diel_light_vs_dark | diel_light_vs_dark | -0.606 | 0.00375 |
| lowFe_KTKB_Day3 | lowFe_KTKB_Day3 | 0.042 | 0.909 |
| lowFe_KTKB_Day5 | lowFe_KTKB_Day5 | 0.381 | 0.075 |
| BaP | BaP | 0.218 | 0.38 |
| exponential_vs_stationary_24highlight | exponential_vs_stationary_24highlight | -0.158 | 0.176 |
| co2_elevated_stat_arrays | co2_elevated_stat_arrays | 0.061 | 0.835 |
| lowtemp_TMEVA | lowtemp_TMEVA | 1.740 | 0.000735 |
| highpH_TMEVA | highpH_TMEVA | 0.285 | 0.0977 |
| co2_elevated_expo_arrays | co2_elevated_expo_arrays | 0.207 | 0.224 |
| lowFe_TMEVA | lowFe_TMEVA | 0.076 | 0.853 |
| exponential_vs_stationary_24light | exponential_vs_stationary_24light | -0.579 | 0.0808 |
| lowN_TMEVA | lowN_TMEVA | 0.045 | 0.894 |
| diel_exponential_vs_stationary | diel_exponential_vs_stationary | -0.367 | 0.0558 |
| lowSi_TMEVA | lowSi_TMEVA | 0.158 | 0.947 |
| highlight_arrays | highlight_arrays | 0.578 | 0.000442 |