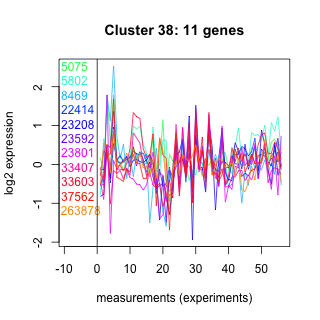
Thaps_hclust_0038 Hierarchical Clustering
Thalassiosira pseudonana
| Cluster Plot | Conditions Plot | Dendrogram |
|---|---|---|
 |
 |
 |
| GO ID | Go Term | p-value | q-value | Cluster |
|---|---|---|---|---|
| GO:0006635 | fatty acid beta-oxidation | 0.00186066 | 1 | Thaps_hclust_0038 |
| GO:0007165 | signal transduction | 0.00231429 | 1 | Thaps_hclust_0038 |
| GO:0000160 | two-component signal transduction system (phosphorelay) | 0.0491703 | 1 | Thaps_hclust_0038 |
| GO:0006468 | protein amino acid phosphorylation | 0.0566487 | 1 | Thaps_hclust_0038 |
| GO:0006355 | regulation of transcription, DNA-dependent | 0.107561 | 1 | Thaps_hclust_0038 |
| GO:0016567 | protein ubiquitination | 0.137853 | 1 | Thaps_hclust_0038 |
|
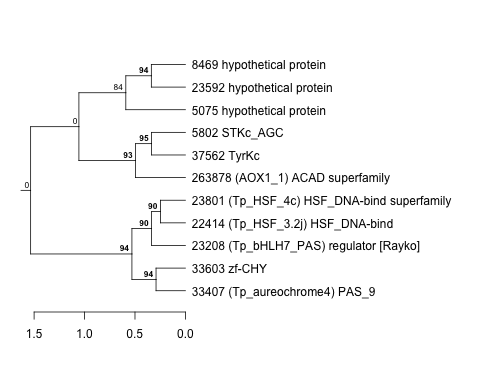
5075 : hypothetical protein |
22414 : (Tp_HSF_3.2j) HSF_DNA-bind |
23801 : (Tp_HSF_4c) HSF_DNA-bind superfamily |
37562 : TyrKc |
|
5802 : STKc_AGC |
23208 : (Tp_bHLH7_PAS) regulator [Rayko] |
33407 : (Tp_aureochrome4) PAS_9 |
263878 : (AOX1_1) ACAD superfamily |
|
8469 : hypothetical protein |
23592 : hypothetical protein |
33603 : zf-CHY |
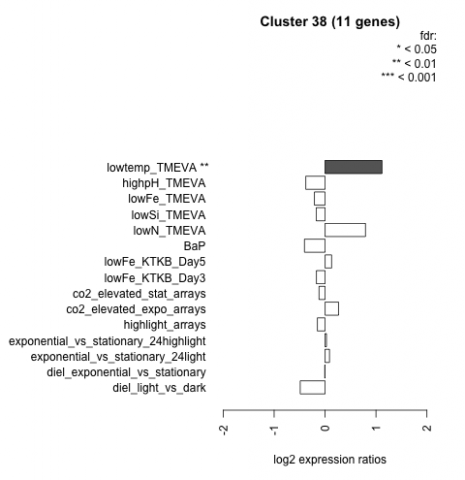
| Condition | Condition | Difference | FDR |
|---|---|---|---|
| lowtemp_TMEVA | lowtemp_TMEVA | 1.120 | 0.00325 |
| lowN_TMEVA | lowN_TMEVA | 0.794 | 0.0566 |
| highpH_TMEVA | highpH_TMEVA | -0.379 | 0.0691 |
| diel_light_vs_dark | diel_light_vs_dark | -0.488 | 0.071 |
| BaP | BaP | -0.404 | 0.161 |
| co2_elevated_expo_arrays | co2_elevated_expo_arrays | 0.265 | 0.17 |
| highlight_arrays | highlight_arrays | -0.152 | 0.498 |
| lowFe_TMEVA | lowFe_TMEVA | -0.210 | 0.553 |
| lowFe_KTKB_Day3 | lowFe_KTKB_Day3 | -0.170 | 0.611 |
| lowFe_KTKB_Day5 | lowFe_KTKB_Day5 | 0.129 | 0.646 |
| co2_elevated_stat_arrays | co2_elevated_stat_arrays | -0.118 | 0.701 |
| exponential_vs_stationary_24light | exponential_vs_stationary_24light | 0.088 | 0.862 |
| exponential_vs_stationary_24highlight | exponential_vs_stationary_24highlight | 0.028 | 0.862 |
| lowSi_TMEVA | lowSi_TMEVA | -0.173 | 0.918 |
| diel_exponential_vs_stationary | diel_exponential_vs_stationary | -0.005 | 0.991 |