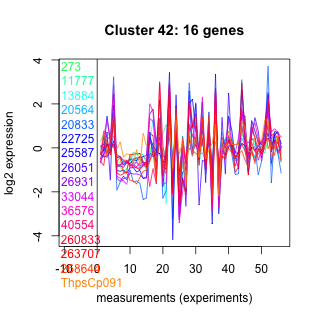
Thaps_hclust_0042 Hierarchical Clustering
Thalassiosira pseudonana
| Cluster Plot | Conditions Plot | Dendrogram |
|---|---|---|
 |
 |
 |
| GO ID | Go Term | p-value | q-value | Cluster |
|---|---|---|---|---|
| GO:0006542 | glutamine biosynthesis | 0.00268762 | 1 | Thaps_hclust_0042 |
| GO:0006430 | lysyl-tRNA aminoacylation | 0.00536856 | 1 | Thaps_hclust_0042 |
| GO:0006807 | nitrogen compound metabolism | 0.0291995 | 1 | Thaps_hclust_0042 |
| GO:0006310 | DNA recombination | 0.0499389 | 1 | Thaps_hclust_0042 |
| GO:0006413 | translational initiation | 0.0626925 | 1 | Thaps_hclust_0042 |
| GO:0006412 | protein biosynthesis | 0.071268 | 1 | Thaps_hclust_0042 |
| GO:0009058 | biosynthesis | 0.138303 | 1 | Thaps_hclust_0042 |
| GO:0006418 | tRNA aminoacylation for protein translation | 0.142982 | 1 | Thaps_hclust_0042 |
| GO:0006396 | RNA processing | 0.145313 | 1 | Thaps_hclust_0042 |
| GO:0016567 | protein ubiquitination | 0.192928 | 1 | Thaps_hclust_0042 |
|
273 : PRK04004 |
20833 : Methyltransf_16 superfamily |
26931 : GTP_cyclohydro1 |
260833 : Uup |
|
11777 : Methyltransf_16 superfamily |
22725 : hypothetical protein |
33044 : PLN02502 |
263707 : Mito_carr |
|
13884 : Uup |
25587 : hypothetical protein |
36576 : TypA |
268644 : PRK11824 |
|
20564 : hypothetical protein |
26051 : (GLNA) PLN02284 |
40554 : Uup |
ThpsCp091 : (thiS) thiamine biosynthesis protein |
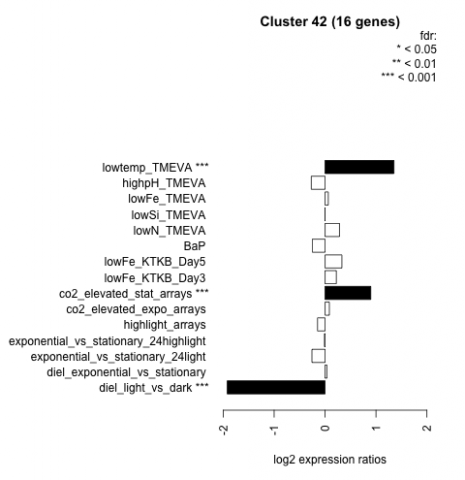
| Condition | Condition | Difference | FDR |
|---|---|---|---|
| diel_light_vs_dark | diel_light_vs_dark | -1.920 | 0.000485 |
| lowFe_KTKB_Day3 | lowFe_KTKB_Day3 | 0.222 | 0.446 |
| lowFe_KTKB_Day5 | lowFe_KTKB_Day5 | 0.331 | 0.146 |
| BaP | BaP | -0.250 | 0.32 |
| exponential_vs_stationary_24highlight | exponential_vs_stationary_24highlight | -0.012 | 0.948 |
| co2_elevated_stat_arrays | co2_elevated_stat_arrays | 0.898 | 0.000658 |
| lowtemp_TMEVA | lowtemp_TMEVA | 1.350 | 0.000735 |
| highpH_TMEVA | highpH_TMEVA | -0.270 | 0.118 |
| co2_elevated_expo_arrays | co2_elevated_expo_arrays | 0.084 | 0.802 |
| lowFe_TMEVA | lowFe_TMEVA | 0.063 | 0.886 |
| exponential_vs_stationary_24light | exponential_vs_stationary_24light | -0.258 | 0.503 |
| lowN_TMEVA | lowN_TMEVA | 0.284 | 0.469 |
| diel_exponential_vs_stationary | diel_exponential_vs_stationary | 0.036 | 0.896 |
| lowSi_TMEVA | lowSi_TMEVA | 0.000 | 1 |
| highlight_arrays | highlight_arrays | -0.148 | 0.423 |