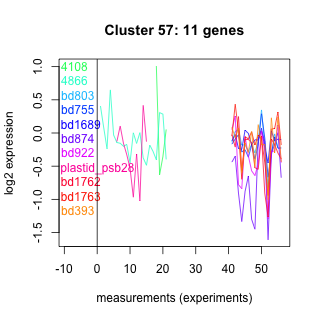
Thaps_hclust_0057 Hierarchical Clustering
Thalassiosira pseudonana
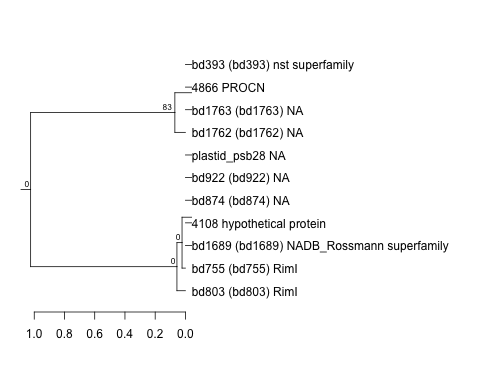
| Cluster Plot | Conditions Plot | Dendrogram |
|---|---|---|
 |
 |
 |
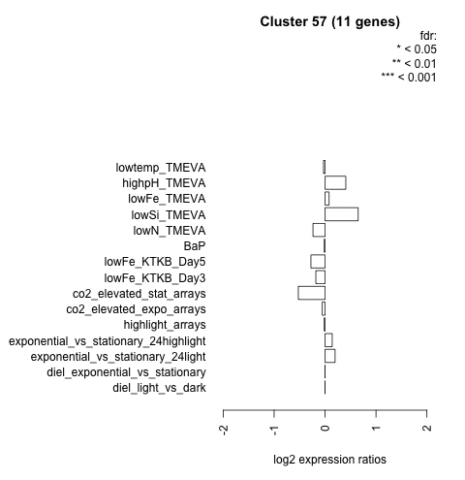
| Condition | Condition | Difference | FDR |
|---|---|---|---|
| highpH_TMEVA | highpH_TMEVA | 0.407 | 0.0512 |
| co2_elevated_stat_arrays | co2_elevated_stat_arrays | -0.525 | 0.0531 |
| lowSi_TMEVA | lowSi_TMEVA | 0.650 | 0.259 |
| lowFe_KTKB_Day5 | lowFe_KTKB_Day5 | -0.278 | 0.301 |
| exponential_vs_stationary_24highlight | exponential_vs_stationary_24highlight | 0.140 | 0.345 |
| lowN_TMEVA | lowN_TMEVA | -0.237 | 0.581 |
| lowFe_KTKB_Day3 | lowFe_KTKB_Day3 | -0.181 | 0.604 |
| exponential_vs_stationary_24light | exponential_vs_stationary_24light | 0.197 | 0.679 |
| lowFe_TMEVA | lowFe_TMEVA | 0.078 | 0.853 |
| co2_elevated_expo_arrays | co2_elevated_expo_arrays | -0.056 | 0.911 |
| lowtemp_TMEVA | lowtemp_TMEVA | -0.030 | 0.941 |
| highlight_arrays | highlight_arrays | -0.018 | 0.942 |
| BaP | BaP | -0.016 | 0.969 |
| diel_exponential_vs_stationary | diel_exponential_vs_stationary | 1 | |
| diel_light_vs_dark | diel_light_vs_dark | 1 |