Thaps_hclust_0074 Hierarchical Clustering
Thalassiosira pseudonana
| Cluster Plot | Conditions Plot | Dendrogram |
|---|---|---|
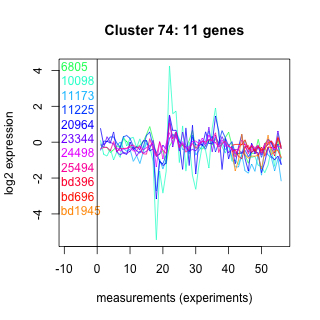 |
 |
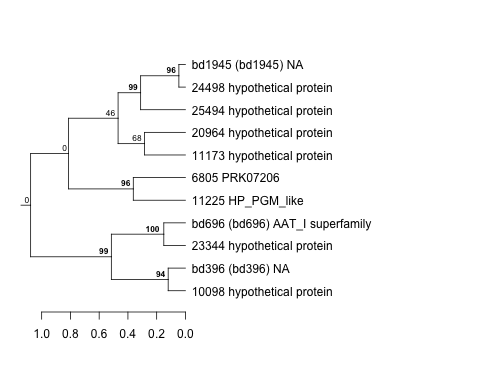 |
| GO ID | Go Term | p-value | q-value | Cluster |
|---|---|---|---|---|
| GO:0000074 | regulation of cell cycle | 0.0246574 | 1 | Thaps_hclust_0074 |
| GO:0008152 | metabolism | 0.161222 | 1 | Thaps_hclust_0074 |
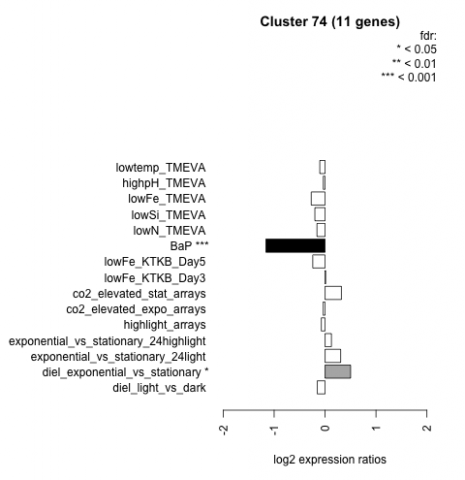
| Condition | Condition | Difference | FDR |
|---|---|---|---|
| diel_light_vs_dark | diel_light_vs_dark | -0.153 | 0.651 |
| lowFe_KTKB_Day3 | lowFe_KTKB_Day3 | 0.013 | 0.975 |
| lowFe_KTKB_Day5 | lowFe_KTKB_Day5 | -0.242 | 0.369 |
| BaP | BaP | -1.160 | 0.00037 |
| exponential_vs_stationary_24highlight | exponential_vs_stationary_24highlight | 0.125 | 0.399 |
| co2_elevated_stat_arrays | co2_elevated_stat_arrays | 0.321 | 0.253 |
| lowtemp_TMEVA | lowtemp_TMEVA | -0.103 | 0.784 |
| highpH_TMEVA | highpH_TMEVA | -0.036 | 0.909 |
| co2_elevated_expo_arrays | co2_elevated_expo_arrays | -0.041 | 0.943 |
| lowFe_TMEVA | lowFe_TMEVA | -0.271 | 0.427 |
| exponential_vs_stationary_24light | exponential_vs_stationary_24light | 0.306 | 0.482 |
| lowN_TMEVA | lowN_TMEVA | -0.158 | 0.721 |
| diel_exponential_vs_stationary | diel_exponential_vs_stationary | 0.501 | 0.0387 |
| lowSi_TMEVA | lowSi_TMEVA | -0.200 | 0.861 |
| highlight_arrays | highlight_arrays | -0.074 | 0.76 |