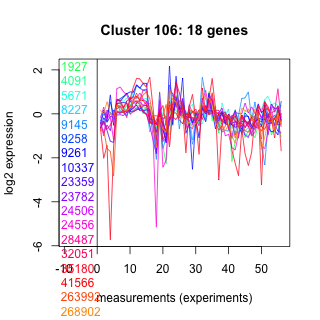
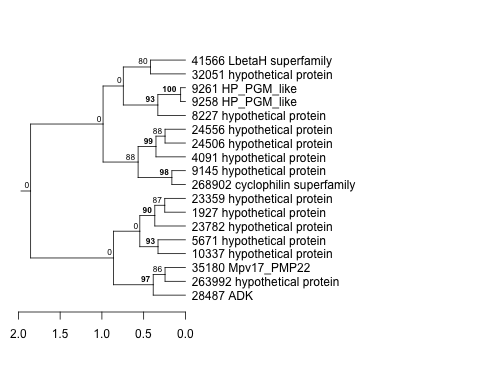
Thaps_hclust_0106 Hierarchical Clustering
Thalassiosira pseudonana
| Cluster Plot | Conditions Plot | Dendrogram |
|---|---|---|
 |
 |
 |
| GO ID | Go Term | p-value | q-value | Cluster |
|---|---|---|---|---|
| GO:0015986 | ATP synthesis coupled proton transport | 0.0375124 | 1 | Thaps_hclust_0106 |
| GO:0006118 | electron transport | 0.20254 | 1 | Thaps_hclust_0106 |
| GO:0006139 | nucleobase, nucleoside, nucleotide and nucleic acid metabolism | 0.0123506 | 1 | Thaps_hclust_0106 |
| GO:0006457 | protein folding | 0.103279 | 1 | Thaps_hclust_0106 |
|
1927 : hypothetical protein |
9258 : HP_PGM_like |
24506 : hypothetical protein |
35180 : Mpv17_PMP22 |
|
4091 : hypothetical protein |
9261 : HP_PGM_like |
24556 : hypothetical protein |
41566 : LbetaH superfamily |
|
5671 : hypothetical protein |
10337 : hypothetical protein |
28487 : ADK |
263992 : hypothetical protein |
|
8227 : hypothetical protein |
23359 : hypothetical protein |
32051 : hypothetical protein |
268902 : cyclophilin superfamily |
|
9145 : hypothetical protein |
23782 : hypothetical protein |
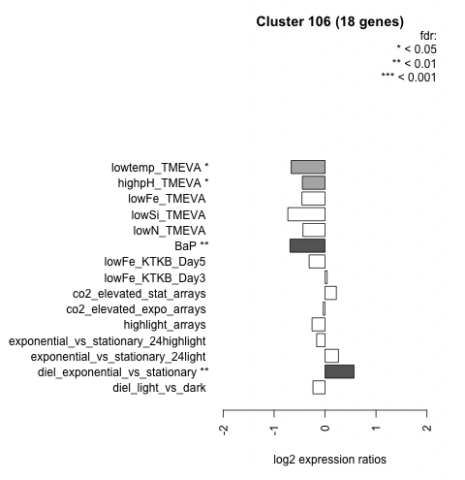
| Condition | Condition | Difference | FDR |
|---|---|---|---|
| diel_light_vs_dark | diel_light_vs_dark | -0.238 | 0.298 |
| lowFe_KTKB_Day3 | lowFe_KTKB_Day3 | 0.040 | 0.91 |
| lowFe_KTKB_Day5 | lowFe_KTKB_Day5 | -0.313 | 0.134 |
| BaP | BaP | -0.688 | 0.00162 |
| exponential_vs_stationary_24highlight | exponential_vs_stationary_24highlight | -0.165 | 0.143 |
| co2_elevated_stat_arrays | co2_elevated_stat_arrays | 0.222 | 0.37 |
| lowtemp_TMEVA | lowtemp_TMEVA | -0.664 | 0.0168 |
| highpH_TMEVA | highpH_TMEVA | -0.445 | 0.0105 |
| co2_elevated_expo_arrays | co2_elevated_expo_arrays | -0.037 | 0.943 |
| lowFe_TMEVA | lowFe_TMEVA | -0.454 | 0.0973 |
| exponential_vs_stationary_24light | exponential_vs_stationary_24light | 0.263 | 0.463 |
| lowN_TMEVA | lowN_TMEVA | -0.434 | 0.212 |
| diel_exponential_vs_stationary | diel_exponential_vs_stationary | 0.568 | 0.00253 |
| lowSi_TMEVA | lowSi_TMEVA | -0.730 | 0.0908 |
| highlight_arrays | highlight_arrays | -0.255 | 0.125 |