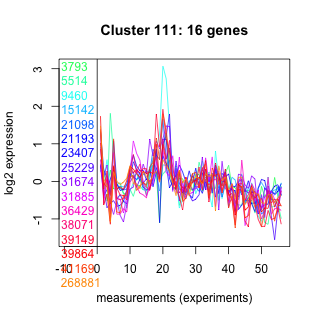
Thaps_hclust_0111 Hierarchical Clustering
Thalassiosira pseudonana
| Cluster Plot | Conditions Plot | Dendrogram |
|---|---|---|
 |
 |
 |
| GO ID | Go Term | p-value | q-value | Cluster |
|---|---|---|---|---|
| GO:0006783 | heme biosynthesis | 0.00660132 | 1 | Thaps_hclust_0111 |
| GO:0006810 | transport | 0.0346463 | 1 | Thaps_hclust_0111 |
| GO:0006457 | protein folding | 0.195964 | 1 | Thaps_hclust_0111 |
| GO:0006468 | protein amino acid phosphorylation | 0.302703 | 1 | Thaps_hclust_0111 |
| GO:0006508 | proteolysis and peptidolysis | 0.38827 | 1 | Thaps_hclust_0111 |
| GO:0006355 | regulation of transcription, DNA-dependent | 0.40843 | 1 | Thaps_hclust_0111 |
| GO:0008152 | metabolism | 0.505245 | 1 | Thaps_hclust_0111 |
|
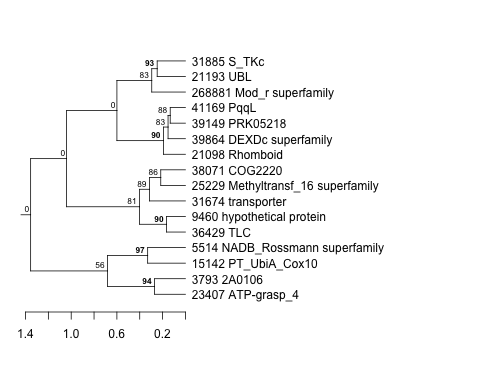
3793 : 2A0106 |
21098 : Rhomboid |
31674 : transporter |
39149 : PRK05218 |
|
5514 : NADB_Rossmann superfamily |
21193 : UBL |
31885 : S_TKc |
39864 : DEXDc superfamily |
|
9460 : hypothetical protein |
23407 : ATP-grasp_4 |
36429 : TLC |
41169 : PqqL |
|
15142 : PT_UbiA_Cox10 |
25229 : Methyltransf_16 superfamily |
38071 : COG2220 |
268881 : Mod_r superfamily |
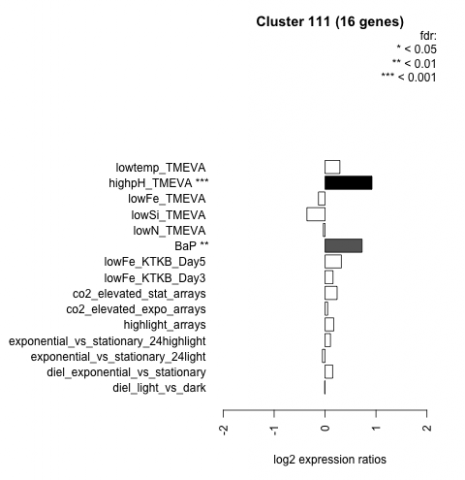
| Condition | Condition | Difference | FDR |
|---|---|---|---|
| diel_light_vs_dark | diel_light_vs_dark | -0.007 | 0.985 |
| lowFe_KTKB_Day3 | lowFe_KTKB_Day3 | 0.155 | 0.604 |
| lowFe_KTKB_Day5 | lowFe_KTKB_Day5 | 0.320 | 0.159 |
| BaP | BaP | 0.726 | 0.00132 |
| exponential_vs_stationary_24highlight | exponential_vs_stationary_24highlight | 0.106 | 0.39 |
| co2_elevated_stat_arrays | co2_elevated_stat_arrays | 0.237 | 0.345 |
| lowtemp_TMEVA | lowtemp_TMEVA | 0.291 | 0.317 |
| highpH_TMEVA | highpH_TMEVA | 0.921 | 0.000725 |
| co2_elevated_expo_arrays | co2_elevated_expo_arrays | 0.052 | 0.911 |
| lowFe_TMEVA | lowFe_TMEVA | -0.130 | 0.733 |
| exponential_vs_stationary_24light | exponential_vs_stationary_24light | -0.052 | 0.9 |
| lowN_TMEVA | lowN_TMEVA | -0.035 | 0.924 |
| diel_exponential_vs_stationary | diel_exponential_vs_stationary | 0.150 | 0.495 |
| lowSi_TMEVA | lowSi_TMEVA | -0.357 | 0.613 |
| highlight_arrays | highlight_arrays | 0.171 | 0.347 |