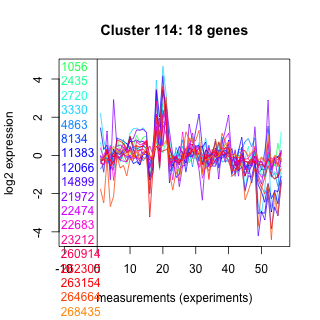
Thaps_hclust_0114 Hierarchical Clustering
Thalassiosira pseudonana
| Cluster Plot | Conditions Plot | Dendrogram |
|---|---|---|
 |
 |
 |
| GO ID | Go Term | p-value | q-value | Cluster |
|---|---|---|---|---|
| GO:0006118 | electron transport | 0.432304 | 1 | Thaps_hclust_0114 |
| GO:0006468 | protein amino acid phosphorylation | 0.362866 | 1 | Thaps_hclust_0114 |
| GO:0006457 | protein folding | 0.238676 | 1 | Thaps_hclust_0114 |
| GO:0016567 | protein ubiquitination | 0.15196 | 1 | Thaps_hclust_0114 |
| GO:0006508 | proteolysis and peptidolysis | 0.459068 | 1 | Thaps_hclust_0114 |
| GO:0006355 | regulation of transcription, DNA-dependent | 0.00246101 | 1 | Thaps_hclust_0114 |
| GO:0006810 | transport | 0.321719 | 1 | Thaps_hclust_0114 |
|
1056 : hypothetical protein |
8134 : hypothetical protein |
22474 : hypothetical protein |
262305 : DnaJ_bact |
|
2435 : hypothetical protein |
11383 : hypothetical protein |
22683 : hypothetical protein |
263154 : (Tp_HSF_3.8b) HSF_DNA-bind superfamily |
|
2720 : (Tp_HSF_3c) HSF_DNA-bind |
12066 : (Tp_HSF_3.7a) HSF_DNA-bind |
23212 : SET |
264664 : TRX_family |
|
3330 : RGS |
14899 : DegQ |
260914 : MFS |
268435 : hypothetical protein |
|
4863 : hypothetical protein |
21972 : hypothetical protein |
| Condition | Condition | Difference | FDR |
|---|---|---|---|
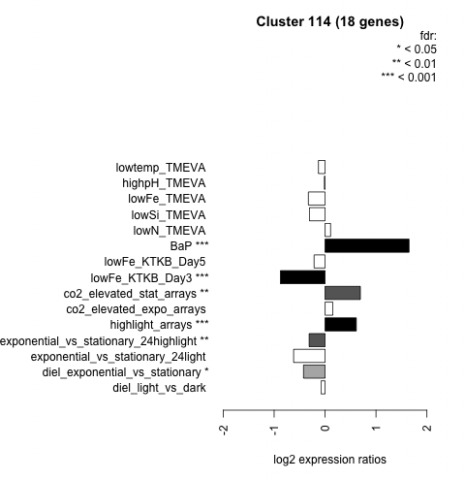
| diel_light_vs_dark | diel_light_vs_dark | -0.079 | 0.796 |
| lowFe_KTKB_Day3 | lowFe_KTKB_Day3 | -0.877 | 0.000862 |
| lowFe_KTKB_Day5 | lowFe_KTKB_Day5 | -0.215 | 0.317 |
| BaP | BaP | 1.650 | 0.00037 |
| exponential_vs_stationary_24highlight | exponential_vs_stationary_24highlight | -0.312 | 0.00577 |
| co2_elevated_stat_arrays | co2_elevated_stat_arrays | 0.693 | 0.00119 |
| lowtemp_TMEVA | lowtemp_TMEVA | -0.131 | 0.65 |
| highpH_TMEVA | highpH_TMEVA | -0.014 | 0.964 |
| co2_elevated_expo_arrays | co2_elevated_expo_arrays | 0.152 | 0.443 |
| lowFe_TMEVA | lowFe_TMEVA | -0.327 | 0.257 |
| exponential_vs_stationary_24light | exponential_vs_stationary_24light | -0.617 | 0.0559 |
| lowN_TMEVA | lowN_TMEVA | 0.109 | 0.784 |
| diel_exponential_vs_stationary | diel_exponential_vs_stationary | -0.423 | 0.0217 |
| lowSi_TMEVA | lowSi_TMEVA | -0.307 | 0.679 |
| highlight_arrays | highlight_arrays | 0.614 | 0.000442 |