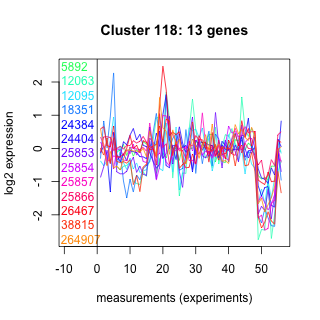
Thaps_hclust_0118 Hierarchical Clustering
Thalassiosira pseudonana
| Cluster Plot | Conditions Plot | Dendrogram |
|---|---|---|
 |
 |
 |
| GO ID | Go Term | p-value | q-value | Cluster |
|---|---|---|---|---|
| GO:0006350 | transcription | 0.0184952 | 1 | Thaps_hclust_0118 |
| GO:0016567 | protein ubiquitination | 0.0482112 | 1 | Thaps_hclust_0118 |
| GO:0006508 | proteolysis and peptidolysis | 0.168231 | 1 | Thaps_hclust_0118 |
|
5892 : MPN superfamily |
24384 : hypothetical protein |
25854 : Peptidase_C48 superfamily |
26467 : hypothetical protein |
|
12063 : hypothetical protein |
24404 : hypothetical protein |
25857 : hypothetical protein |
38815 : (Rpb8) RNA_pol_Rpb8 superfamily |
|
12095 : hypothetical protein |
25853 : hypothetical protein |
25866 : WD40 superfamily |
264907 : (SelD) selD |
|
18351 : Maf |
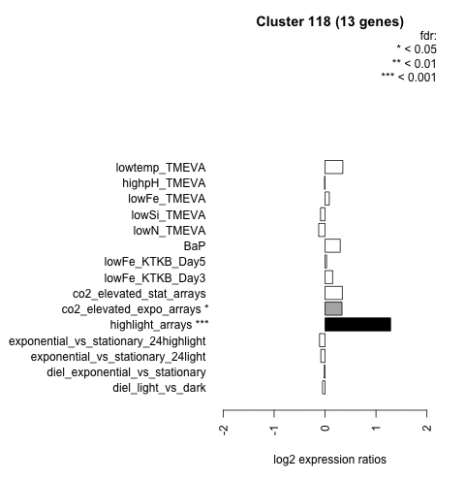
| Condition | Condition | Difference | FDR |
|---|---|---|---|
| BaP | BaP | 0.298 | 0.279 |
| co2_elevated_expo_arrays | co2_elevated_expo_arrays | 0.333 | 0.0414 |
| co2_elevated_stat_arrays | co2_elevated_stat_arrays | 0.340 | 0.189 |
| diel_exponential_vs_stationary | diel_exponential_vs_stationary | -0.015 | 0.965 |
| diel_light_vs_dark | diel_light_vs_dark | -0.049 | 0.902 |
| exponential_vs_stationary_24highlight | exponential_vs_stationary_24highlight | -0.109 | 0.428 |
| exponential_vs_stationary_24light | exponential_vs_stationary_24light | -0.082 | 0.862 |
| highlight_arrays | highlight_arrays | 1.290 | 0.000442 |
| highpH_TMEVA | highpH_TMEVA | -0.009 | 0.982 |
| lowFe_KTKB_Day3 | lowFe_KTKB_Day3 | 0.149 | 0.646 |
| lowFe_KTKB_Day5 | lowFe_KTKB_Day5 | 0.030 | 0.915 |
| lowFe_TMEVA | lowFe_TMEVA | 0.083 | 0.853 |
| lowN_TMEVA | lowN_TMEVA | -0.125 | 0.761 |
| lowSi_TMEVA | lowSi_TMEVA | -0.089 | 0.997 |
| lowtemp_TMEVA | lowtemp_TMEVA | 0.349 | 0.263 |