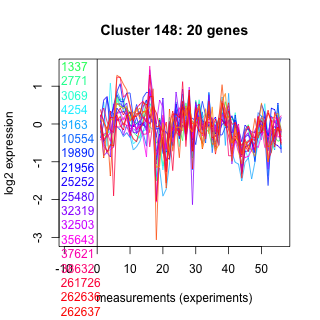
Thaps_hclust_0148 Hierarchical Clustering
Thalassiosira pseudonana
| Cluster Plot | Conditions Plot | Dendrogram |
|---|---|---|
 |
 |
 |
| GO ID | Go Term | p-value | q-value | Cluster |
|---|---|---|---|---|
| GO:0019538 | protein metabolism | 0.0557488 | 1 | Thaps_hclust_0148 |
| GO:0006457 | protein folding | 0.150875 | 1 | Thaps_hclust_0148 |
| GO:0006468 | protein amino acid phosphorylation | 0.236888 | 1 | Thaps_hclust_0148 |
| GO:0006508 | proteolysis and peptidolysis | 0.308243 | 1 | Thaps_hclust_0148 |
| GO:0006355 | regulation of transcription, DNA-dependent | 0.325408 | 1 | Thaps_hclust_0148 |
| GO:0008152 | metabolism | 0.410014 | 1 | Thaps_hclust_0148 |
|
1337 : hypothetical protein |
10554 : hypothetical protein |
32319 : 5_nucleotid superfamily |
261726 : hypothetical protein |
|
2771 : hypothetical protein |
19890 : CbpA |
32503 : LETM1 superfamily |
262636 : hypothetical protein |
|
3069 : hypothetical protein |
21956 : GcvR |
35643 : STKc_MOK |
262637 : P4Hc |
|
4254 : hypothetical protein |
25252 : hypothetical protein |
37621 : Ptr |
262807 : Peptidase_S9 superfamily |
|
9163 : hypothetical protein |
25480 : (Tp_Myb2R8) regulator [Rayko] |
38632 : Esterase_lipase superfamily |
263001 : (MYB19) |
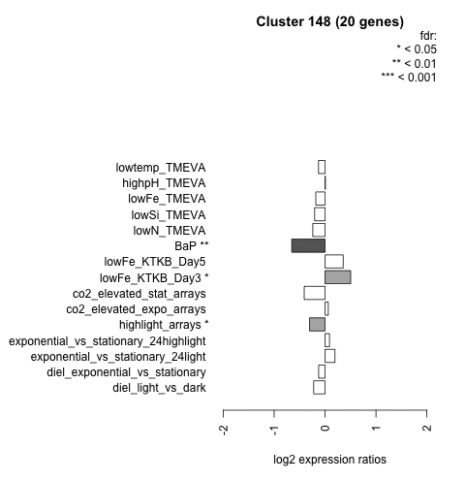
| Condition | Condition | Difference | FDR |
|---|---|---|---|
| BaP | BaP | -0.654 | 0.00162 |
| co2_elevated_expo_arrays | co2_elevated_expo_arrays | 0.063 | 0.873 |
| co2_elevated_stat_arrays | co2_elevated_stat_arrays | -0.409 | 0.0598 |
| diel_exponential_vs_stationary | diel_exponential_vs_stationary | -0.126 | 0.533 |
| diel_light_vs_dark | diel_light_vs_dark | -0.224 | 0.307 |
| exponential_vs_stationary_24highlight | exponential_vs_stationary_24highlight | 0.087 | 0.452 |
| exponential_vs_stationary_24light | exponential_vs_stationary_24light | 0.194 | 0.597 |
| highlight_arrays | highlight_arrays | -0.304 | 0.0479 |
| highpH_TMEVA | highpH_TMEVA | 0.007 | 0.984 |
| lowFe_KTKB_Day3 | lowFe_KTKB_Day3 | 0.503 | 0.0239 |
| lowFe_KTKB_Day5 | lowFe_KTKB_Day5 | 0.357 | 0.0684 |
| lowFe_TMEVA | lowFe_TMEVA | -0.182 | 0.549 |
| lowN_TMEVA | lowN_TMEVA | -0.241 | 0.505 |
| lowSi_TMEVA | lowSi_TMEVA | -0.205 | 0.854 |
| lowtemp_TMEVA | lowtemp_TMEVA | -0.129 | 0.64 |