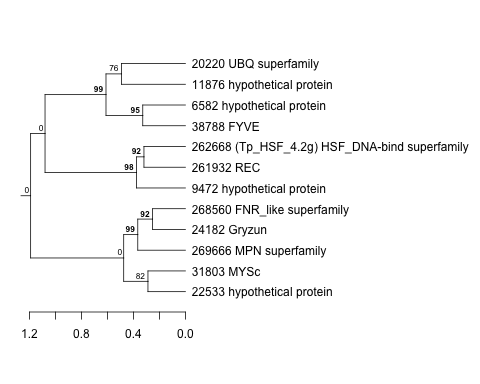
Thaps_hclust_0160 Hierarchical Clustering
Thalassiosira pseudonana
| Cluster Plot | Conditions Plot | Dendrogram |
|---|---|---|
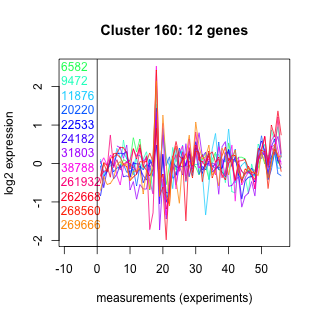 |
 |
 |
| GO ID | Go Term | p-value | q-value | Cluster |
|---|---|---|---|---|
| GO:0000160 | two-component signal transduction system (phosphorelay) | 0.0330448 | 1 | Thaps_hclust_0160 |
| GO:0006355 | regulation of transcription, DNA-dependent | 0.0508003 | 1 | Thaps_hclust_0160 |
| GO:0006464 | protein modification | 0.0710257 | 1 | Thaps_hclust_0160 |
| GO:0016567 | protein ubiquitination | 0.0941262 | 1 | Thaps_hclust_0160 |
| GO:0006118 | electron transport | 0.287914 | 1 | Thaps_hclust_0160 |
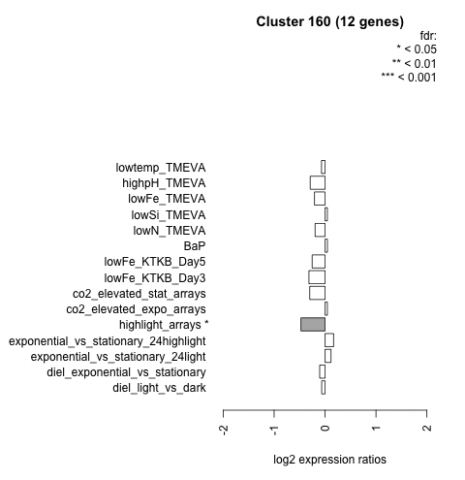
| Condition | Condition | Difference | FDR |
|---|---|---|---|
| diel_light_vs_dark | diel_light_vs_dark | -0.066 | 0.863 |
| lowFe_KTKB_Day3 | lowFe_KTKB_Day3 | -0.317 | 0.315 |
| lowFe_KTKB_Day5 | lowFe_KTKB_Day5 | -0.253 | 0.334 |
| BaP | BaP | 0.046 | 0.897 |
| exponential_vs_stationary_24highlight | exponential_vs_stationary_24highlight | 0.168 | 0.23 |
| co2_elevated_stat_arrays | co2_elevated_stat_arrays | -0.301 | 0.275 |
| lowtemp_TMEVA | lowtemp_TMEVA | -0.070 | 0.848 |
| highpH_TMEVA | highpH_TMEVA | -0.291 | 0.146 |
| co2_elevated_expo_arrays | co2_elevated_expo_arrays | 0.045 | 0.934 |
| lowFe_TMEVA | lowFe_TMEVA | -0.208 | 0.553 |
| exponential_vs_stationary_24light | exponential_vs_stationary_24light | 0.116 | 0.813 |
| lowN_TMEVA | lowN_TMEVA | -0.195 | 0.661 |
| diel_exponential_vs_stationary | diel_exponential_vs_stationary | -0.106 | 0.693 |
| lowSi_TMEVA | lowSi_TMEVA | 0.045 | 1 |
| highlight_arrays | highlight_arrays | -0.474 | 0.0127 |