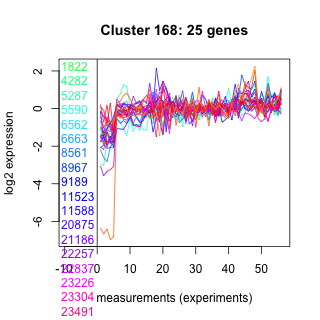
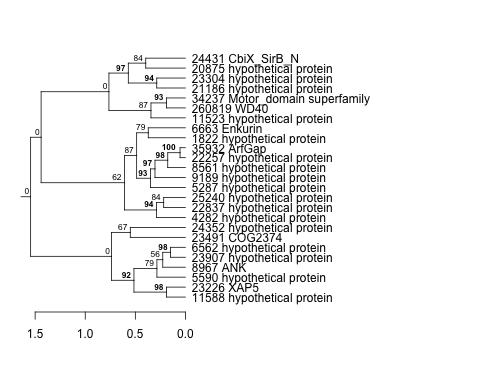
Thaps_hclust_0168 Hierarchical Clustering
Thalassiosira pseudonana
| Cluster Plot | Conditions Plot | Dendrogram |
|---|---|---|
 |
 |
 |
| GO ID | Go Term | p-value | q-value | Cluster |
|---|---|---|---|---|
| GO:0043087 | regulation of GTPase activity | 0.00619065 | 1 | Thaps_hclust_0168 |
| GO:0007018 | microtubule-based movement | 0.0264385 | 1 | Thaps_hclust_0168 |
| GO:0016567 | protein ubiquitination | 0.0482112 | 1 | Thaps_hclust_0168 |
|
1822 : hypothetical protein |
8967 : ANK |
22257 : hypothetical protein |
24352 : hypothetical protein |
|
4282 : hypothetical protein |
9189 : hypothetical protein |
22837 : hypothetical protein |
24431 : CbiX_SirB_N |
|
5287 : hypothetical protein |
11523 : hypothetical protein |
23226 : XAP5 |
25240 : hypothetical protein |
|
5590 : hypothetical protein |
11588 : hypothetical protein |
23304 : hypothetical protein |
34237 : Motor_domain superfamily |
|
6562 : hypothetical protein |
20875 : hypothetical protein |
23491 : COG2374 |
35932 : ArfGap |
|
6663 : Enkurin |
21186 : hypothetical protein |
23907 : hypothetical protein |
260819 : WD40 |
|
8561 : hypothetical protein |
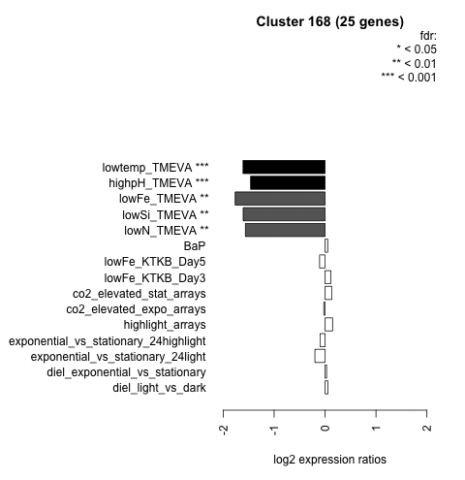
| Condition | Condition | Difference | FDR |
|---|---|---|---|
| BaP | BaP | 0.053 | 0.824 |
| co2_elevated_expo_arrays | co2_elevated_expo_arrays | -0.024 | 0.969 |
| co2_elevated_stat_arrays | co2_elevated_stat_arrays | 0.134 | 0.59 |
| diel_exponential_vs_stationary | diel_exponential_vs_stationary | 0.031 | 0.889 |
| diel_light_vs_dark | diel_light_vs_dark | 0.057 | 0.831 |
| exponential_vs_stationary_24highlight | exponential_vs_stationary_24highlight | -0.098 | 0.315 |
| exponential_vs_stationary_24light | exponential_vs_stationary_24light | -0.199 | 0.545 |
| highlight_arrays | highlight_arrays | 0.149 | 0.318 |
| highpH_TMEVA | highpH_TMEVA | -1.460 | 0.000725 |
| lowFe_KTKB_Day3 | lowFe_KTKB_Day3 | 0.113 | 0.642 |
| lowFe_KTKB_Day5 | lowFe_KTKB_Day5 | -0.108 | 0.584 |
| lowFe_TMEVA | lowFe_TMEVA | -1.770 | 0.00104 |
| lowN_TMEVA | lowN_TMEVA | -1.560 | 0.00119 |
| lowSi_TMEVA | lowSi_TMEVA | -1.610 | 0.00135 |
| lowtemp_TMEVA | lowtemp_TMEVA | -1.610 | 0.000735 |