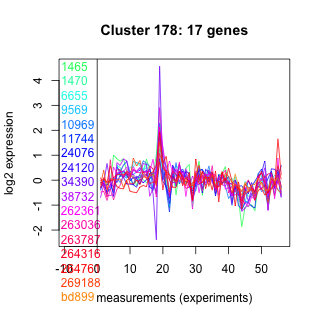
Thaps_hclust_0178 Hierarchical Clustering
Thalassiosira pseudonana
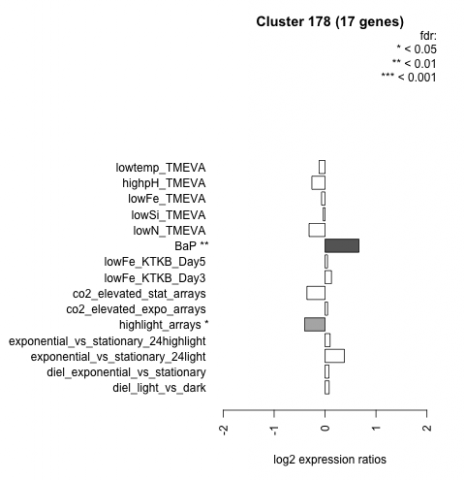
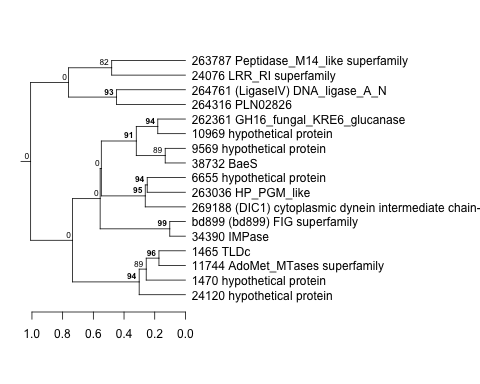
| Cluster Plot | Conditions Plot | Dendrogram |
|---|---|---|
 |
 |
 |
| GO ID | Go Term | p-value | q-value | Cluster |
|---|---|---|---|---|
| GO:0006207 | 'de novo' pyrimidine base biosynthesis | 0.00515995 | 1 | Thaps_hclust_0178 |
| GO:0006511 | ubiquitin-dependent protein catabolism | 0.0516395 | 1 | Thaps_hclust_0178 |
| GO:0006468 | protein amino acid phosphorylation | 0.201698 | 1 | Thaps_hclust_0178 |
| GO:0006508 | proteolysis and peptidolysis | 0.264399 | 1 | Thaps_hclust_0178 |
| GO:0008152 | metabolism | 0.355748 | 1 | Thaps_hclust_0178 |
|
1465 : TLDc |
11744 : AdoMet_MTases superfamily |
38732 : BaeS |
264316 : PLN02826 |
|
1470 : hypothetical protein |
24076 : LRR_RI superfamily |
262361 : GH16_fungal_KRE6_glucanase |
264761 : (LigaseIV) DNA_ligase_A_N |
|
6655 : hypothetical protein |
24120 : hypothetical protein |
263036 : HP_PGM_like |
269188 : (DIC1) cytoplasmic dynein intermediate chain-like protein |
|
9569 : hypothetical protein |
34390 : IMPase |
263787 : Peptidase_M14_like superfamily |
bd899 : (bd899) FIG superfamily |
|
10969 : hypothetical protein |
| Condition | Condition | Difference | FDR |
|---|---|---|---|
| highlight_arrays | highlight_arrays | -0.402 | 0.0183 |
| co2_elevated_stat_arrays | co2_elevated_stat_arrays | -0.357 | 0.128 |
| lowN_TMEVA | lowN_TMEVA | -0.314 | 0.384 |
| highpH_TMEVA | highpH_TMEVA | -0.259 | 0.126 |
| lowtemp_TMEVA | lowtemp_TMEVA | -0.117 | 0.701 |
| lowFe_TMEVA | lowFe_TMEVA | -0.069 | 0.86 |
| lowSi_TMEVA | lowSi_TMEVA | -0.037 | 1 |
| lowFe_KTKB_Day5 | lowFe_KTKB_Day5 | 0.048 | 0.849 |
| co2_elevated_expo_arrays | co2_elevated_expo_arrays | 0.051 | 0.911 |
| diel_exponential_vs_stationary | diel_exponential_vs_stationary | 0.076 | 0.746 |
| diel_light_vs_dark | diel_light_vs_dark | 0.080 | 0.798 |
| exponential_vs_stationary_24highlight | exponential_vs_stationary_24highlight | 0.098 | 0.425 |
| lowFe_KTKB_Day3 | lowFe_KTKB_Day3 | 0.126 | 0.675 |
| exponential_vs_stationary_24light | exponential_vs_stationary_24light | 0.379 | 0.269 |
| BaP | BaP | 0.665 | 0.00359 |