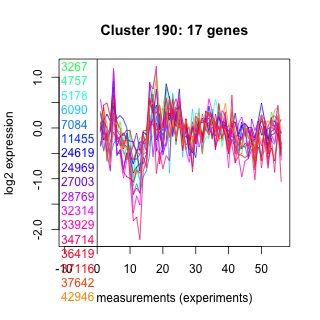
Thaps_hclust_0190 Hierarchical Clustering
Thalassiosira pseudonana
| Cluster Plot | Conditions Plot | Dendrogram |
|---|---|---|
 |
 |
 |
| GO ID | Go Term | p-value | q-value | Cluster |
|---|---|---|---|---|
| GO:0009306 | protein secretion | 0.00742418 | 1 | Thaps_hclust_0190 |
| GO:0015780 | nucleotide-sugar transport | 0.00927255 | 1 | Thaps_hclust_0190 |
| GO:0006564 | L-serine biosynthesis | 0.0166355 | 1 | Thaps_hclust_0190 |
| GO:0008643 | carbohydrate transport | 0.0257707 | 1 | Thaps_hclust_0190 |
| GO:0006397 | mRNA processing | 0.0402303 | 1 | Thaps_hclust_0190 |
| GO:0009058 | biosynthesis | 0.0978804 | 1 | Thaps_hclust_0190 |
| GO:0006118 | electron transport | 0.399203 | 1 | Thaps_hclust_0190 |
| GO:0006508 | proteolysis and peptidolysis | 0.424754 | 1 | Thaps_hclust_0190 |
| GO:0008152 | metabolism | 0.546944 | 1 | Thaps_hclust_0190 |
|
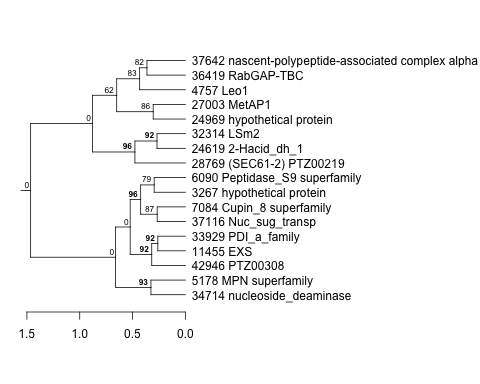
3267 : hypothetical protein |
11455 : EXS |
28769 : (SEC61-2) PTZ00219 |
36419 : RabGAP-TBC |
|
4757 : Leo1 |
24619 : 2-Hacid_dh_1 |
32314 : LSm2 |
37116 : Nuc_sug_transp |
|
5178 : MPN superfamily |
24969 : hypothetical protein |
33929 : PDI_a_family |
37642 : nascent-polypeptide-associated complex alpha polypeptide-like protein |
|
6090 : Peptidase_S9 superfamily |
27003 : MetAP1 |
34714 : nucleoside_deaminase |
42946 : PTZ00308 |
|
7084 : Cupin_8 superfamily |
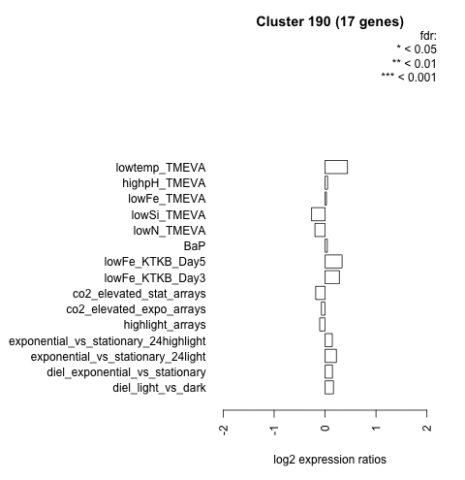
| Condition | Condition | Difference | FDR |
|---|---|---|---|
| diel_light_vs_dark | diel_light_vs_dark | 0.165 | 0.532 |
| lowFe_KTKB_Day3 | lowFe_KTKB_Day3 | 0.282 | 0.284 |
| lowFe_KTKB_Day5 | lowFe_KTKB_Day5 | 0.335 | 0.117 |
| BaP | BaP | 0.044 | 0.895 |
| exponential_vs_stationary_24highlight | exponential_vs_stationary_24highlight | 0.142 | 0.229 |
| co2_elevated_stat_arrays | co2_elevated_stat_arrays | -0.185 | 0.475 |
| lowtemp_TMEVA | lowtemp_TMEVA | 0.439 | 0.117 |
| highpH_TMEVA | highpH_TMEVA | 0.050 | 0.811 |
| co2_elevated_expo_arrays | co2_elevated_expo_arrays | -0.073 | 0.833 |
| lowFe_TMEVA | lowFe_TMEVA | 0.028 | 0.951 |
| exponential_vs_stationary_24light | exponential_vs_stationary_24light | 0.223 | 0.558 |
| lowN_TMEVA | lowN_TMEVA | -0.198 | 0.605 |
| diel_exponential_vs_stationary | diel_exponential_vs_stationary | 0.146 | 0.503 |
| lowSi_TMEVA | lowSi_TMEVA | -0.266 | 0.781 |
| highlight_arrays | highlight_arrays | -0.106 | 0.578 |