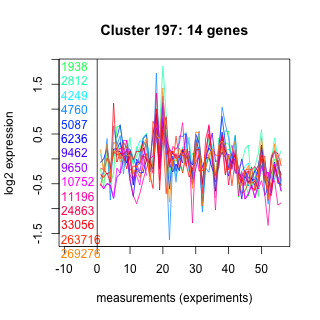
Thaps_hclust_0197 Hierarchical Clustering
Thalassiosira pseudonana
| Cluster Plot | Conditions Plot | Dendrogram |
|---|---|---|
 |
 |
 |
| GO ID | Go Term | p-value | q-value | Cluster |
|---|---|---|---|---|
| GO:0006810 | transport | 0.143738 | 1 | Thaps_hclust_0197 |
| GO:0006508 | proteolysis and peptidolysis | 0.217787 | 1 | Thaps_hclust_0197 |
| GO:0006284 | base-excision repair | 0.00000769 | 0.0280251 | Thaps_hclust_0197 |
|
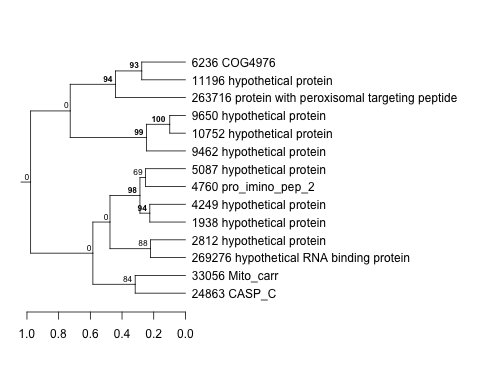
1938 : hypothetical protein |
5087 : hypothetical protein |
10752 : hypothetical protein |
33056 : Mito_carr |
|
2812 : hypothetical protein |
6236 : COG4976 |
11196 : hypothetical protein |
263716 : protein with peroxisomal targeting peptide |
|
4249 : hypothetical protein |
9462 : hypothetical protein |
24863 : CASP_C |
269276 : hypothetical RNA binding protein |
|
4760 : pro_imino_pep_2 |
9650 : hypothetical protein |
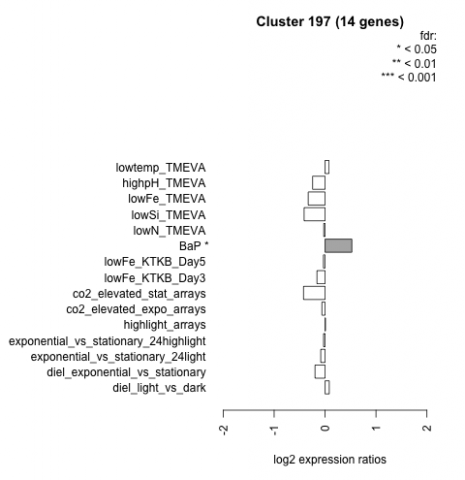
| Condition | Condition | Difference | FDR |
|---|---|---|---|
| diel_light_vs_dark | diel_light_vs_dark | 0.082 | 0.807 |
| lowFe_KTKB_Day3 | lowFe_KTKB_Day3 | -0.159 | 0.604 |
| lowFe_KTKB_Day5 | lowFe_KTKB_Day5 | -0.032 | 0.908 |
| BaP | BaP | 0.526 | 0.0356 |
| exponential_vs_stationary_24highlight | exponential_vs_stationary_24highlight | -0.029 | 0.847 |
| co2_elevated_stat_arrays | co2_elevated_stat_arrays | -0.422 | 0.0834 |
| lowtemp_TMEVA | lowtemp_TMEVA | 0.077 | 0.824 |
| highpH_TMEVA | highpH_TMEVA | -0.245 | 0.179 |
| co2_elevated_expo_arrays | co2_elevated_expo_arrays | -0.061 | 0.89 |
| lowFe_TMEVA | lowFe_TMEVA | -0.330 | 0.297 |
| exponential_vs_stationary_24light | exponential_vs_stationary_24light | -0.084 | 0.862 |
| lowN_TMEVA | lowN_TMEVA | -0.025 | 0.954 |
| diel_exponential_vs_stationary | diel_exponential_vs_stationary | -0.197 | 0.389 |
| lowSi_TMEVA | lowSi_TMEVA | -0.412 | 0.547 |
| highlight_arrays | highlight_arrays | 0.008 | 0.973 |