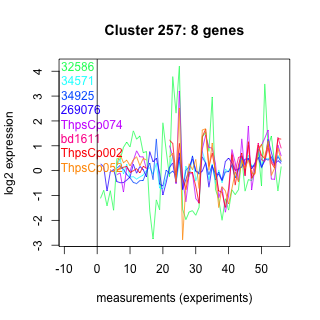
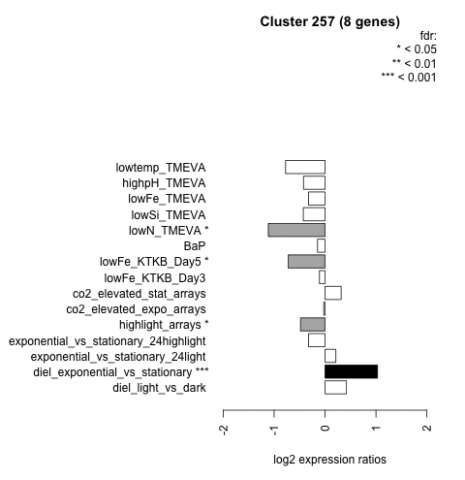
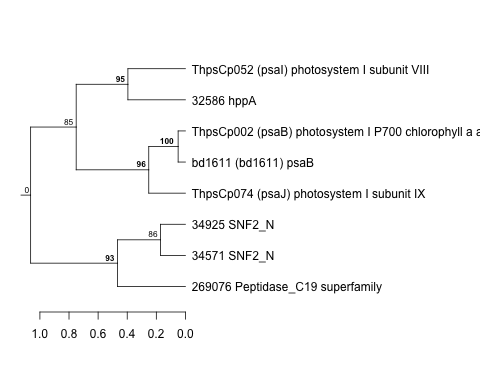
Thaps_hclust_0257 Hierarchical Clustering
Thalassiosira pseudonana
| Cluster Plot | Conditions Plot | Dendrogram |
|---|---|---|
 |
 |
 |
| GO ID | Go Term | p-value | q-value | Cluster |
|---|---|---|---|---|
| GO:0015992 | proton transport | 0.00927638 | 1 | Thaps_hclust_0257 |
| GO:0006511 | ubiquitin-dependent protein catabolism | 0.0313052 | 1 | Thaps_hclust_0257 |
| GO:0016567 | protein ubiquitination | 0.0482112 | 1 | Thaps_hclust_0257 |
| Condition | Condition | Difference | FDR |
|---|---|---|---|
| diel_light_vs_dark | diel_light_vs_dark | 0.419 | 0.199 |
| lowFe_KTKB_Day3 | lowFe_KTKB_Day3 | -0.110 | 0.795 |
| lowFe_KTKB_Day5 | lowFe_KTKB_Day5 | -0.726 | 0.031 |
| BaP | BaP | -0.149 | 0.698 |
| exponential_vs_stationary_24highlight | exponential_vs_stationary_24highlight | -0.324 | 0.0529 |
| co2_elevated_stat_arrays | co2_elevated_stat_arrays | 0.316 | 0.301 |
| lowtemp_TMEVA | lowtemp_TMEVA | -0.776 | 0.0659 |
| highpH_TMEVA | highpH_TMEVA | -0.422 | 0.0872 |
| co2_elevated_expo_arrays | co2_elevated_expo_arrays | -0.026 | 0.969 |
| lowFe_TMEVA | lowFe_TMEVA | -0.324 | 0.395 |
| exponential_vs_stationary_24light | exponential_vs_stationary_24light | 0.211 | 0.698 |
| lowN_TMEVA | lowN_TMEVA | -1.110 | 0.0313 |
| diel_exponential_vs_stationary | diel_exponential_vs_stationary | 1.030 | 0.000602 |
| lowSi_TMEVA | lowSi_TMEVA | -0.427 | 0.574 |
| highlight_arrays | highlight_arrays | -0.481 | 0.0476 |