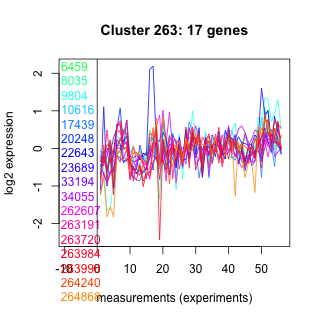
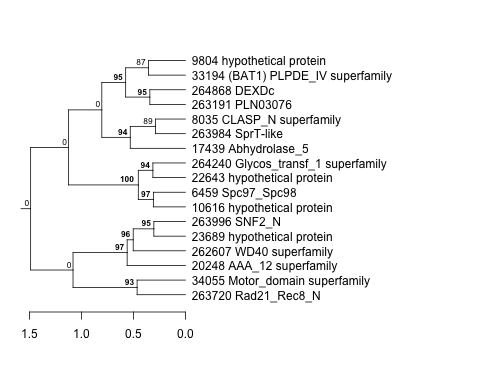
Thaps_hclust_0263 Hierarchical Clustering
Thalassiosira pseudonana
| Cluster Plot | Conditions Plot | Dendrogram |
|---|---|---|
 |
 |
 |
| GO ID | Go Term | p-value | q-value | Cluster |
|---|---|---|---|---|
| GO:0000226 | microtubule cytoskeleton organization and biogenesis | 0.00289256 | 1 | Thaps_hclust_0263 |
| GO:0007018 | microtubule-based movement | 0.06063 | 1 | Thaps_hclust_0263 |
| GO:0005975 | carbohydrate metabolism | 0.103679 | 1 | Thaps_hclust_0263 |
| GO:0016567 | protein ubiquitination | 0.10894 | 1 | Thaps_hclust_0263 |
| GO:0006118 | electron transport | 0.327122 | 1 | Thaps_hclust_0263 |
| GO:0006355 | regulation of transcription, DNA-dependent | 0.368277 | 1 | Thaps_hclust_0263 |
| GO:0008152 | metabolism | 0.459719 | 1 | Thaps_hclust_0263 |
|
6459 : Spc97_Spc98 |
20248 : AAA_12 superfamily |
34055 : Motor_domain superfamily |
263984 : SprT-like |
|
8035 : CLASP_N superfamily |
22643 : hypothetical protein |
262607 : WD40 superfamily |
263996 : SNF2_N |
|
9804 : hypothetical protein |
23689 : hypothetical protein |
263191 : PLN03076 |
264240 : Glycos_transf_1 superfamily |
|
10616 : hypothetical protein |
33194 : (BAT1) PLPDE_IV superfamily |
263720 : Rad21_Rec8_N |
264868 : DEXDc |
|
17439 : Abhydrolase_5 |
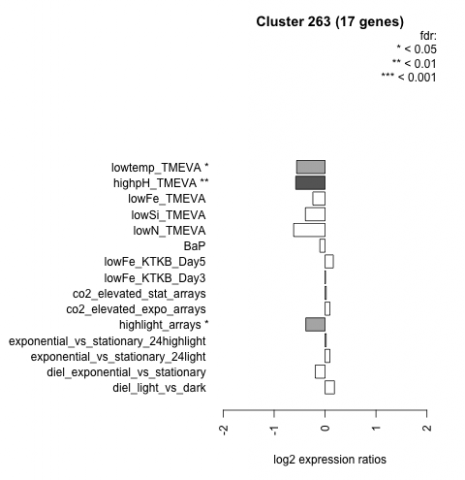
| Condition | Condition | Difference | FDR |
|---|---|---|---|
| diel_light_vs_dark | diel_light_vs_dark | 0.184 | 0.47 |
| lowFe_KTKB_Day3 | lowFe_KTKB_Day3 | 0.009 | 0.978 |
| lowFe_KTKB_Day5 | lowFe_KTKB_Day5 | 0.162 | 0.477 |
| BaP | BaP | -0.101 | 0.71 |
| exponential_vs_stationary_24highlight | exponential_vs_stationary_24highlight | 0.021 | 0.89 |
| co2_elevated_stat_arrays | co2_elevated_stat_arrays | 0.022 | 0.941 |
| lowtemp_TMEVA | lowtemp_TMEVA | -0.557 | 0.0456 |
| highpH_TMEVA | highpH_TMEVA | -0.575 | 0.00253 |
| co2_elevated_expo_arrays | co2_elevated_expo_arrays | 0.095 | 0.748 |
| lowFe_TMEVA | lowFe_TMEVA | -0.239 | 0.427 |
| exponential_vs_stationary_24light | exponential_vs_stationary_24light | 0.094 | 0.823 |
| lowN_TMEVA | lowN_TMEVA | -0.616 | 0.0727 |
| diel_exponential_vs_stationary | diel_exponential_vs_stationary | -0.191 | 0.363 |
| lowSi_TMEVA | lowSi_TMEVA | -0.386 | 0.557 |
| highlight_arrays | highlight_arrays | -0.378 | 0.0276 |