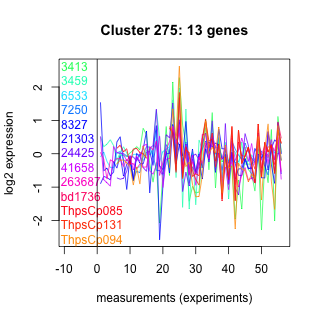
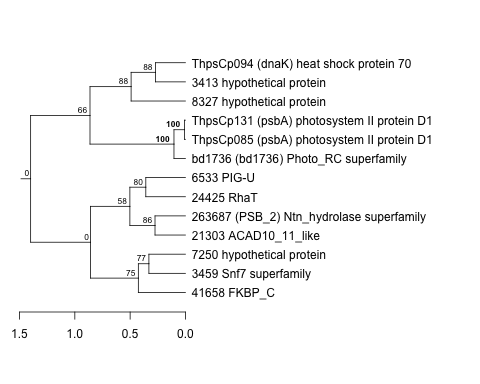
Thaps_hclust_0275 Hierarchical Clustering
Thalassiosira pseudonana
| Cluster Plot | Conditions Plot | Dendrogram |
|---|---|---|
 |
 |
 |
| GO ID | Go Term | p-value | q-value | Cluster |
|---|---|---|---|---|
| GO:0006506 | GPI anchor biosynthesis | 0.000826959 | 1 | Thaps_hclust_0275 |
| GO:0006511 | ubiquitin-dependent protein catabolism | 0.0415252 | 1 | Thaps_hclust_0275 |
| GO:0006457 | protein folding | 0.103279 | 1 | Thaps_hclust_0275 |
| GO:0006468 | protein amino acid phosphorylation | 0.164893 | 1 | Thaps_hclust_0275 |
|
3413 : hypothetical protein |
8327 : hypothetical protein |
41658 : FKBP_C |
ThpsCp085 : (psbA) photosystem II protein D1 |
|
3459 : Snf7 superfamily |
21303 : ACAD10_11_like |
263687 : (PSB_2) Ntn_hydrolase superfamily |
ThpsCp131 : (psbA) photosystem II protein D1 |
|
6533 : PIG-U |
24425 : RhaT |
bd1736 : (bd1736) Photo_RC superfamily |
ThpsCp094 : (dnaK) heat shock protein 70 |
|
7250 : hypothetical protein |
| Condition | Condition | Difference | FDR |
|---|---|---|---|
| diel_light_vs_dark | diel_light_vs_dark | 0.727 | 0.00342 |
| lowFe_KTKB_Day3 | lowFe_KTKB_Day3 | -0.138 | 0.675 |
| lowFe_KTKB_Day5 | lowFe_KTKB_Day5 | -0.148 | 0.581 |
| BaP | BaP | -0.149 | 0.616 |
| exponential_vs_stationary_24highlight | exponential_vs_stationary_24highlight | 0.368 | 0.0072 |
| co2_elevated_stat_arrays | co2_elevated_stat_arrays | 0.273 | 0.299 |
| lowtemp_TMEVA | lowtemp_TMEVA | -0.163 | 0.619 |
| highpH_TMEVA | highpH_TMEVA | 0.270 | 0.165 |
| co2_elevated_expo_arrays | co2_elevated_expo_arrays | -0.175 | 0.429 |
| lowFe_TMEVA | lowFe_TMEVA | -0.311 | 0.331 |
| exponential_vs_stationary_24light | exponential_vs_stationary_24light | 0.555 | 0.138 |
| lowN_TMEVA | lowN_TMEVA | -0.452 | 0.25 |
| diel_exponential_vs_stationary | diel_exponential_vs_stationary | 0.599 | 0.00455 |
| lowSi_TMEVA | lowSi_TMEVA | -0.431 | 0.501 |
| highlight_arrays | highlight_arrays | -0.290 | 0.134 |