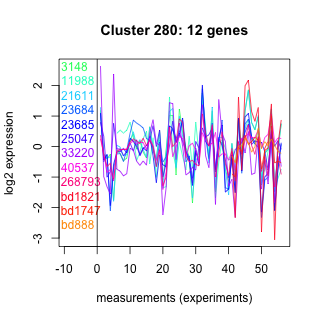
Thaps_hclust_0280 Hierarchical Clustering
Thalassiosira pseudonana
| Cluster Plot | Conditions Plot | Dendrogram |
|---|---|---|
 |
 |
 |
| GO ID | Go Term | p-value | q-value | Cluster |
|---|---|---|---|---|
| GO:0006810 | transport | 0.00169278 | 1 | Thaps_hclust_0280 |
| GO:0006508 | proteolysis and peptidolysis | 0.0608081 | 1 | Thaps_hclust_0280 |
| GO:0006464 | protein modification | 0.0823711 | 1 | Thaps_hclust_0280 |
| GO:0016567 | protein ubiquitination | 0.10894 | 1 | Thaps_hclust_0280 |
|
3148 : Peptidase_C1A |
23684 : hypothetical protein |
33220 : (MSA1) PMSR superfamily |
bd1821 : (bd1821) NA |
|
11988 : hypothetical protein |
23685 : hypothetical protein |
40537 : Ammonium_transp superfamily |
bd1747 : (bd1747) NA |
|
21611 : Peptidase_C1A |
25047 : hypothetical protein |
268793 : (AMT6) amt |
bd888 : (bd888) NA |
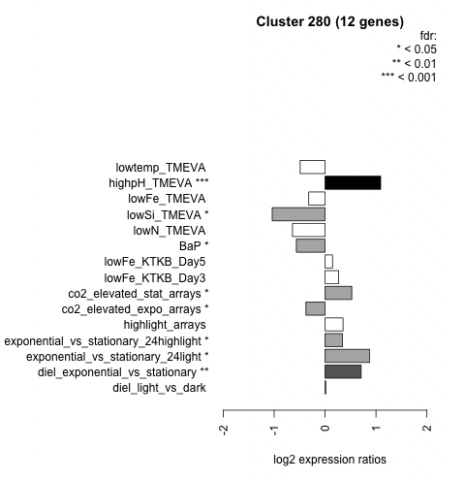
| Condition | Condition | Difference | FDR |
|---|---|---|---|
| lowSi_TMEVA | lowSi_TMEVA | -1.040 | 0.0286 |
| lowN_TMEVA | lowN_TMEVA | -0.640 | 0.117 |
| BaP | BaP | -0.564 | 0.0416 |
| lowtemp_TMEVA | lowtemp_TMEVA | -0.490 | 0.145 |
| co2_elevated_expo_arrays | co2_elevated_expo_arrays | -0.377 | 0.0218 |
| lowFe_TMEVA | lowFe_TMEVA | -0.322 | 0.349 |
| diel_light_vs_dark | diel_light_vs_dark | 0.015 | 0.97 |
| lowFe_KTKB_Day5 | lowFe_KTKB_Day5 | 0.148 | 0.589 |
| lowFe_KTKB_Day3 | lowFe_KTKB_Day3 | 0.266 | 0.418 |
| exponential_vs_stationary_24highlight | exponential_vs_stationary_24highlight | 0.341 | 0.0133 |
| highlight_arrays | highlight_arrays | 0.354 | 0.0715 |
| co2_elevated_stat_arrays | co2_elevated_stat_arrays | 0.526 | 0.0447 |
| diel_exponential_vs_stationary | diel_exponential_vs_stationary | 0.708 | 0.00425 |
| exponential_vs_stationary_24light | exponential_vs_stationary_24light | 0.876 | 0.0221 |
| highpH_TMEVA | highpH_TMEVA | 1.090 | 0.000725 |