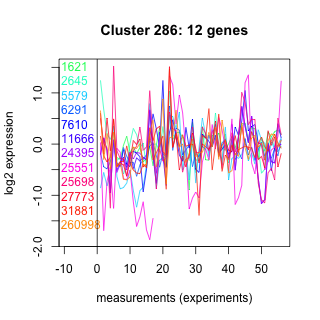
Thaps_hclust_0286 Hierarchical Clustering
Thalassiosira pseudonana
| Cluster Plot | Conditions Plot | Dendrogram |
|---|---|---|
 |
 |
 |
| GO ID | Go Term | p-value | q-value | Cluster |
|---|---|---|---|---|
| GO:0006725 | aromatic compound metabolism | 0.0135857 | 1 | Thaps_hclust_0286 |
| GO:0006865 | amino acid transport | 0.0178824 | 1 | Thaps_hclust_0286 |
| GO:0006468 | protein amino acid phosphorylation | 0.1264 | 1 | Thaps_hclust_0286 |
|
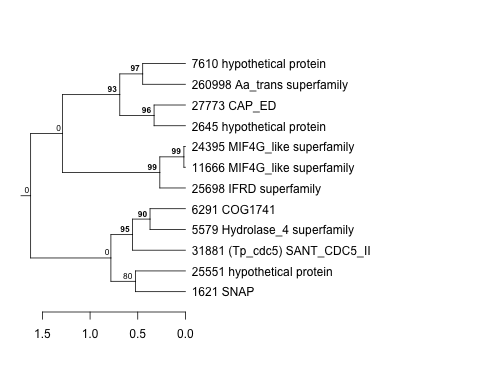
1621 : SNAP |
6291 : COG1741 |
24395 : MIF4G_like superfamily |
27773 : CAP_ED |
|
2645 : hypothetical protein |
7610 : hypothetical protein |
25551 : hypothetical protein |
31881 : (Tp_cdc5) SANT_CDC5_II |
|
5579 : Hydrolase_4 superfamily |
11666 : MIF4G_like superfamily |
25698 : IFRD superfamily |
260998 : Aa_trans superfamily |
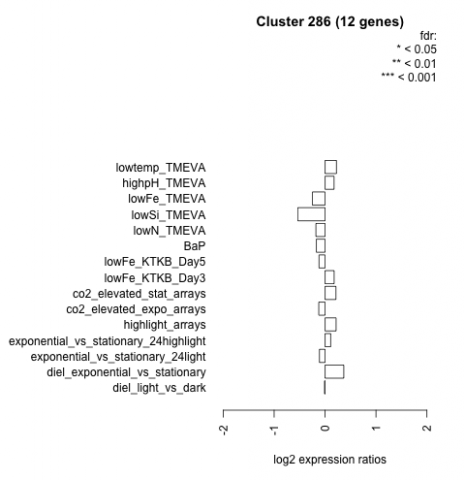
| Condition | Condition | Difference | FDR |
|---|---|---|---|
| BaP | BaP | -0.171 | 0.566 |
| co2_elevated_expo_arrays | co2_elevated_expo_arrays | -0.123 | 0.662 |
| co2_elevated_stat_arrays | co2_elevated_stat_arrays | 0.213 | 0.444 |
| diel_exponential_vs_stationary | diel_exponential_vs_stationary | 0.368 | 0.109 |
| diel_light_vs_dark | diel_light_vs_dark | -0.010 | 0.977 |
| exponential_vs_stationary_24highlight | exponential_vs_stationary_24highlight | 0.111 | 0.434 |
| exponential_vs_stationary_24light | exponential_vs_stationary_24light | -0.111 | 0.82 |
| highlight_arrays | highlight_arrays | 0.216 | 0.293 |
| highpH_TMEVA | highpH_TMEVA | 0.176 | 0.392 |
| lowFe_KTKB_Day3 | lowFe_KTKB_Day3 | 0.178 | 0.604 |
| lowFe_KTKB_Day5 | lowFe_KTKB_Day5 | -0.118 | 0.679 |
| lowFe_TMEVA | lowFe_TMEVA | -0.249 | 0.456 |
| lowN_TMEVA | lowN_TMEVA | -0.179 | 0.685 |
| lowSi_TMEVA | lowSi_TMEVA | -0.536 | 0.389 |
| lowtemp_TMEVA | lowtemp_TMEVA | 0.224 | 0.498 |