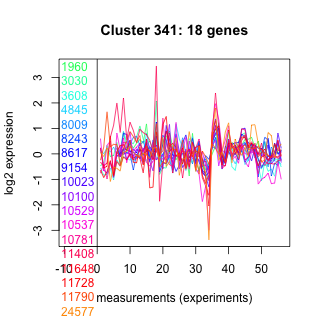
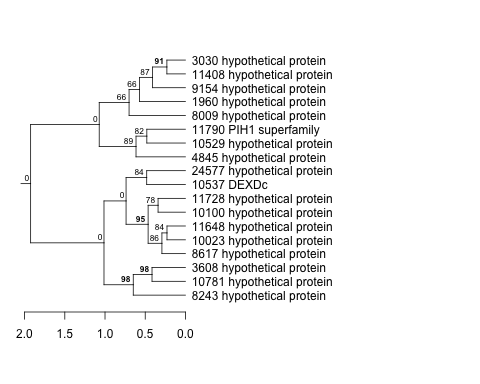
Thaps_hclust_0341 Hierarchical Clustering
Thalassiosira pseudonana
| Cluster Plot | Conditions Plot | Dendrogram |
|---|---|---|
 |
 |
 |
| GO ID | Go Term | p-value | q-value | Cluster |
|---|---|---|---|---|
| GO:0006310 | DNA recombination | 0.0117404 | 1 | Thaps_hclust_0341 |
| GO:0006508 | proteolysis and peptidolysis | 0.168231 | 1 | Thaps_hclust_0341 |
| GO:0000074 | regulation of cell cycle | 0.036761 | 1 | Thaps_hclust_0341 |
|
1960 : hypothetical protein |
8243 : hypothetical protein |
10529 : hypothetical protein |
11648 : hypothetical protein |
|
3030 : hypothetical protein |
8617 : hypothetical protein |
10537 : DEXDc |
11728 : hypothetical protein |
|
3608 : hypothetical protein |
9154 : hypothetical protein |
10781 : hypothetical protein |
11790 : PIH1 superfamily |
|
4845 : hypothetical protein |
10023 : hypothetical protein |
11408 : hypothetical protein |
24577 : hypothetical protein |
|
8009 : hypothetical protein |
10100 : hypothetical protein |
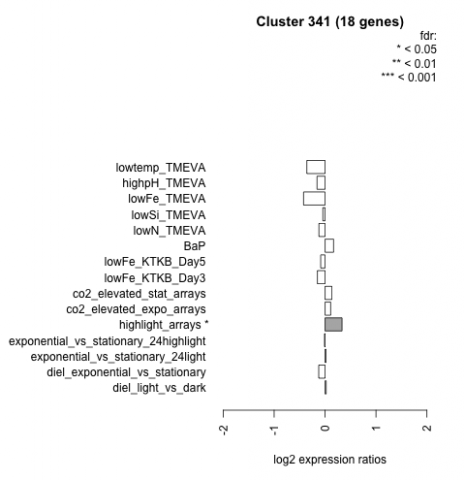
| Condition | Condition | Difference | FDR |
|---|---|---|---|
| diel_light_vs_dark | diel_light_vs_dark | 0.022 | 0.959 |
| lowFe_KTKB_Day3 | lowFe_KTKB_Day3 | -0.151 | 0.6 |
| lowFe_KTKB_Day5 | lowFe_KTKB_Day5 | -0.086 | 0.712 |
| BaP | BaP | 0.167 | 0.503 |
| exponential_vs_stationary_24highlight | exponential_vs_stationary_24highlight | -0.011 | 0.954 |
| co2_elevated_stat_arrays | co2_elevated_stat_arrays | 0.134 | 0.615 |
| lowtemp_TMEVA | lowtemp_TMEVA | -0.358 | 0.185 |
| highpH_TMEVA | highpH_TMEVA | -0.157 | 0.359 |
| co2_elevated_expo_arrays | co2_elevated_expo_arrays | 0.111 | 0.664 |
| lowFe_TMEVA | lowFe_TMEVA | -0.422 | 0.133 |
| exponential_vs_stationary_24light | exponential_vs_stationary_24light | 0.019 | 0.965 |
| lowN_TMEVA | lowN_TMEVA | -0.120 | 0.761 |
| diel_exponential_vs_stationary | diel_exponential_vs_stationary | -0.124 | 0.559 |
| lowSi_TMEVA | lowSi_TMEVA | -0.043 | 1 |
| highlight_arrays | highlight_arrays | 0.334 | 0.0381 |