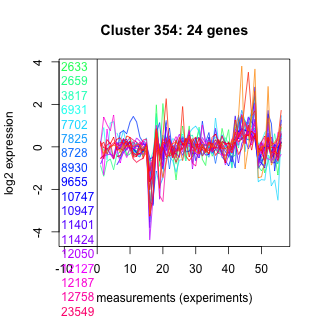
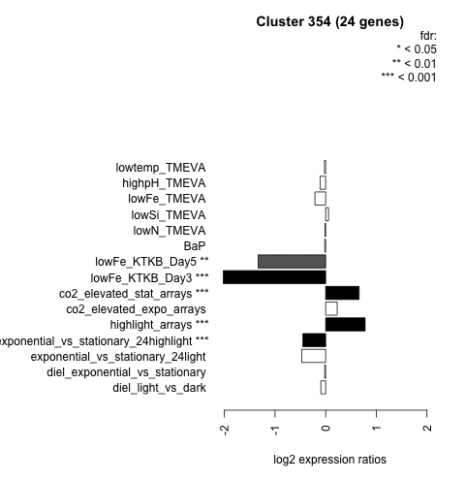
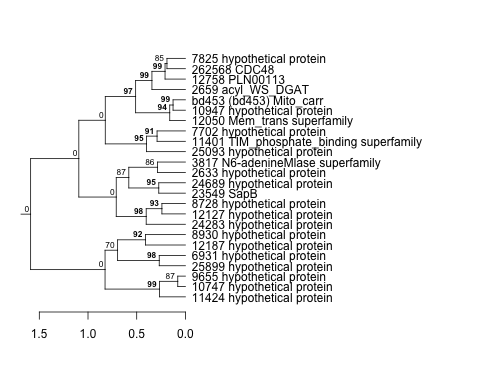
Thaps_hclust_0354 Hierarchical Clustering
Thalassiosira pseudonana
| Cluster Plot | Conditions Plot | Dendrogram |
|---|---|---|
 |
 |
 |
| GO ID | Go Term | p-value | q-value | Cluster |
|---|---|---|---|---|
| GO:0006306 | DNA methylation | 0.00599545 | 1 | Thaps_hclust_0354 |
|
2633 : hypothetical protein |
8728 : hypothetical protein |
11424 : hypothetical protein |
24283 : hypothetical protein |
|
2659 : acyl_WS_DGAT |
8930 : hypothetical protein |
12050 : Mem_trans superfamily |
24689 : hypothetical protein |
|
3817 : N6-adenineMlase superfamily |
9655 : hypothetical protein |
12127 : hypothetical protein |
25093 : hypothetical protein |
|
6931 : hypothetical protein |
10747 : hypothetical protein |
12187 : hypothetical protein |
25899 : hypothetical protein |
|
7702 : hypothetical protein |
10947 : hypothetical protein |
12758 : PLN00113 |
262568 : CDC48 |
|
7825 : hypothetical protein |
11401 : TIM_phosphate_binding superfamily |
23549 : SapB |
bd453 : (bd453) Mito_carr |
| Condition | Condition | Difference | FDR |
|---|---|---|---|
| diel_light_vs_dark | diel_light_vs_dark | -0.094 | 0.703 |
| lowFe_KTKB_Day3 | lowFe_KTKB_Day3 | -2.020 | 0.000862 |
| lowFe_KTKB_Day5 | lowFe_KTKB_Day5 | -1.330 | 0.00132 |
| BaP | BaP | -0.016 | 0.953 |
| exponential_vs_stationary_24highlight | exponential_vs_stationary_24highlight | -0.451 | 0.000526 |
| co2_elevated_stat_arrays | co2_elevated_stat_arrays | 0.660 | 0.000658 |
| lowtemp_TMEVA | lowtemp_TMEVA | -0.022 | 0.945 |
| highpH_TMEVA | highpH_TMEVA | -0.110 | 0.481 |
| co2_elevated_expo_arrays | co2_elevated_expo_arrays | 0.228 | 0.0842 |
| lowFe_TMEVA | lowFe_TMEVA | -0.211 | 0.432 |
| exponential_vs_stationary_24light | exponential_vs_stationary_24light | -0.471 | 0.101 |
| lowN_TMEVA | lowN_TMEVA | -0.013 | 0.975 |
| diel_exponential_vs_stationary | diel_exponential_vs_stationary | -0.019 | 0.938 |
| lowSi_TMEVA | lowSi_TMEVA | 0.057 | 1 |
| highlight_arrays | highlight_arrays | 0.779 | 0.000442 |