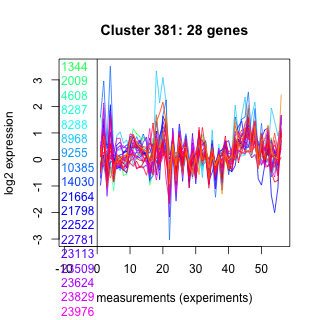
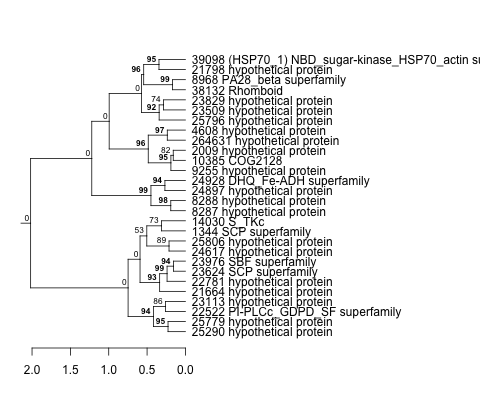
Thaps_hclust_0381 Hierarchical Clustering
Thalassiosira pseudonana
| Cluster Plot | Conditions Plot | Dendrogram |
|---|---|---|
 |
 |
 |
| GO ID | Go Term | p-value | q-value | Cluster |
|---|---|---|---|---|
| GO:0006814 | sodium ion transport | 0.00906837 | 1 | Thaps_hclust_0381 |
| GO:0000074 | regulation of cell cycle | 0.0487168 | 1 | Thaps_hclust_0381 |
| GO:0006468 | protein amino acid phosphorylation | 0.164893 | 1 | Thaps_hclust_0381 |
| GO:0006508 | proteolysis and peptidolysis | 0.217787 | 1 | Thaps_hclust_0381 |
|
1344 : SCP superfamily |
10385 : COG2128 |
23509 : hypothetical protein |
25290 : hypothetical protein |
|
2009 : hypothetical protein |
14030 : S_TKc |
23624 : SCP superfamily |
25779 : hypothetical protein |
|
4608 : hypothetical protein |
21664 : hypothetical protein |
23829 : hypothetical protein |
25796 : hypothetical protein |
|
8287 : hypothetical protein |
21798 : hypothetical protein |
23976 : SBF superfamily |
25806 : hypothetical protein |
|
8288 : hypothetical protein |
22522 : PI-PLCc_GDPD_SF superfamily |
24617 : hypothetical protein |
38132 : Rhomboid |
|
8968 : PA28_beta superfamily |
22781 : hypothetical protein |
24897 : hypothetical protein |
39098 : (HSP70_1) NBD_sugar-kinase_HSP70_actin superfamily |
|
9255 : hypothetical protein |
23113 : hypothetical protein |
24928 : DHQ_Fe-ADH superfamily |
264631 : hypothetical protein |
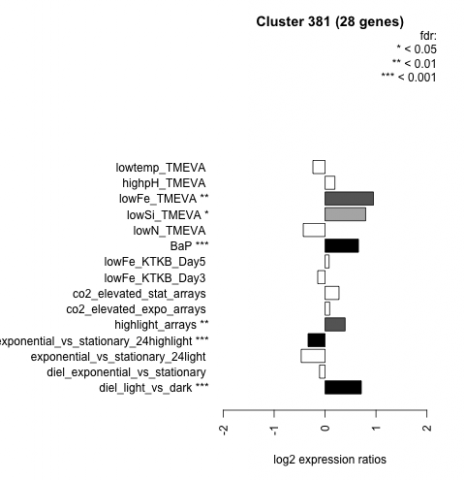
| Condition | Condition | Difference | FDR |
|---|---|---|---|
| diel_light_vs_dark | diel_light_vs_dark | 0.713 | 0.000485 |
| lowFe_KTKB_Day3 | lowFe_KTKB_Day3 | -0.144 | 0.516 |
| lowFe_KTKB_Day5 | lowFe_KTKB_Day5 | 0.079 | 0.684 |
| BaP | BaP | 0.656 | 0.00037 |
| exponential_vs_stationary_24highlight | exponential_vs_stationary_24highlight | -0.334 | 0.000526 |
| co2_elevated_stat_arrays | co2_elevated_stat_arrays | 0.274 | 0.169 |
| lowtemp_TMEVA | lowtemp_TMEVA | -0.238 | 0.269 |
| highpH_TMEVA | highpH_TMEVA | 0.192 | 0.164 |
| co2_elevated_expo_arrays | co2_elevated_expo_arrays | 0.091 | 0.724 |
| lowFe_TMEVA | lowFe_TMEVA | 0.952 | 0.00104 |
| exponential_vs_stationary_24light | exponential_vs_stationary_24light | -0.469 | 0.0752 |
| lowN_TMEVA | lowN_TMEVA | -0.428 | 0.113 |
| diel_exponential_vs_stationary | diel_exponential_vs_stationary | -0.109 | 0.533 |
| lowSi_TMEVA | lowSi_TMEVA | 0.797 | 0.0116 |
| highlight_arrays | highlight_arrays | 0.395 | 0.00157 |