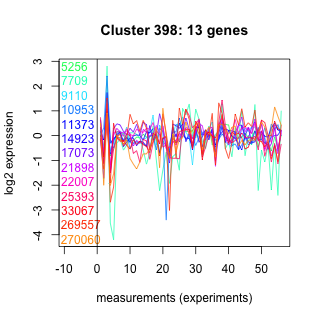
Thaps_hclust_0398 Hierarchical Clustering
Thalassiosira pseudonana
| Cluster Plot | Conditions Plot | Dendrogram |
|---|---|---|
 |
 |
 |
| GO ID | Go Term | p-value | q-value | Cluster |
|---|---|---|---|---|
| GO:0006810 | transport | 0.0380401 | 1 | Thaps_hclust_0398 |
|
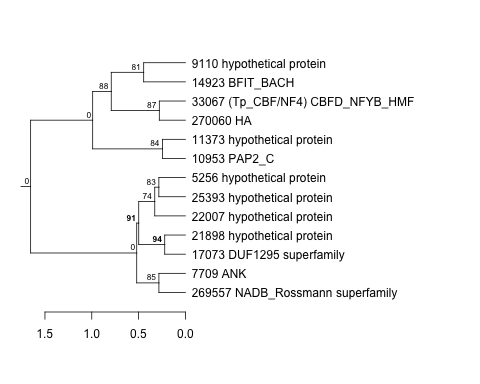
5256 : hypothetical protein |
11373 : hypothetical protein |
21898 : hypothetical protein |
33067 : (Tp_CBF/NF4) CBFD_NFYB_HMF |
|
7709 : ANK |
14923 : BFIT_BACH |
22007 : hypothetical protein |
269557 : NADB_Rossmann superfamily |
|
9110 : hypothetical protein |
17073 : DUF1295 superfamily |
25393 : hypothetical protein |
270060 : HA |
|
10953 : PAP2_C |
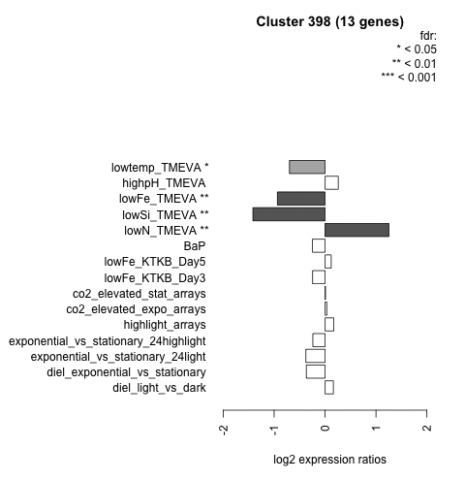
| Condition | Condition | Difference | FDR |
|---|---|---|---|
| diel_light_vs_dark | diel_light_vs_dark | 0.164 | 0.584 |
| lowFe_KTKB_Day3 | lowFe_KTKB_Day3 | -0.245 | 0.429 |
| lowFe_KTKB_Day5 | lowFe_KTKB_Day5 | 0.121 | 0.652 |
| BaP | BaP | -0.249 | 0.374 |
| exponential_vs_stationary_24highlight | exponential_vs_stationary_24highlight | -0.240 | 0.0659 |
| co2_elevated_stat_arrays | co2_elevated_stat_arrays | 0.008 | 0.977 |
| lowtemp_TMEVA | lowtemp_TMEVA | -0.699 | 0.0313 |
| highpH_TMEVA | highpH_TMEVA | 0.260 | 0.178 |
| co2_elevated_expo_arrays | co2_elevated_expo_arrays | 0.035 | 0.944 |
| lowFe_TMEVA | lowFe_TMEVA | -0.935 | 0.00603 |
| exponential_vs_stationary_24light | exponential_vs_stationary_24light | -0.377 | 0.337 |
| lowN_TMEVA | lowN_TMEVA | 1.250 | 0.00119 |
| diel_exponential_vs_stationary | diel_exponential_vs_stationary | -0.367 | 0.0964 |
| lowSi_TMEVA | lowSi_TMEVA | -1.420 | 0.00135 |
| highlight_arrays | highlight_arrays | 0.171 | 0.405 |