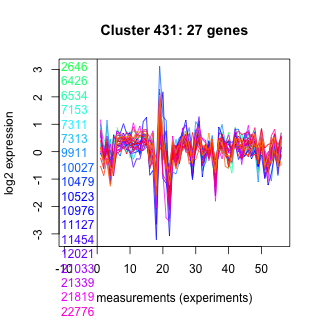
Thaps_hclust_0431 Hierarchical Clustering
Thalassiosira pseudonana
| Cluster Plot | Conditions Plot | Dendrogram |
|---|---|---|
 |
 |
 |
| GO ID | Go Term | p-value | q-value | Cluster |
|---|---|---|---|---|
| GO:0006397 | mRNA processing | 0.0014945 | 1 | Thaps_hclust_0431 |
| GO:0007067 | mitosis | 0.00804286 | 1 | Thaps_hclust_0431 |
| GO:0006120 | mitochondrial electron transport, NADH to ubiquinone | 0.00804286 | 1 | Thaps_hclust_0431 |
| GO:0007242 | intracellular signaling cascade | 0.107309 | 1 | Thaps_hclust_0431 |
| GO:0006886 | intracellular protein transport | 0.135954 | 1 | Thaps_hclust_0431 |
| GO:0006396 | RNA processing | 0.145313 | 1 | Thaps_hclust_0431 |
| GO:0006464 | protein modification | 0.147638 | 1 | Thaps_hclust_0431 |
| GO:0016567 | protein ubiquitination | 0.192928 | 1 | Thaps_hclust_0431 |
| GO:0006412 | protein biosynthesis | 0.365269 | 1 | Thaps_hclust_0431 |
| GO:0006810 | transport | 0.396381 | 1 | Thaps_hclust_0431 |
|
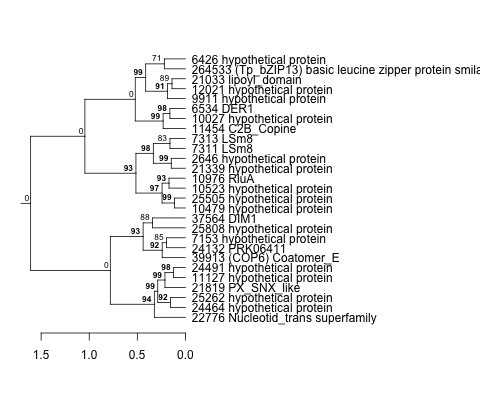
2646 : hypothetical protein |
10027 : hypothetical protein |
21033 : lipoyl_domain |
25262 : hypothetical protein |
|
6426 : hypothetical protein |
10479 : hypothetical protein |
21339 : hypothetical protein |
25505 : hypothetical protein |
|
6534 : DER1 |
10523 : hypothetical protein |
21819 : PX_SNX_like |
25808 : hypothetical protein |
|
7153 : hypothetical protein |
10976 : RluA |
22776 : Nucleotid_trans superfamily |
37564 : DIM1 |
|
7311 : LSm8 |
11127 : hypothetical protein |
24132 : PRK06411 |
39913 : (COP6) Coatomer_E |
|
7313 : LSm8 |
11454 : C2B_Copine |
24464 : hypothetical protein |
264533 : (Tp_bZIP13) basic leucine zipper protein smilarity, DNA binding, transcription factor |
|
9911 : hypothetical protein |
12021 : hypothetical protein |
24491 : hypothetical protein |
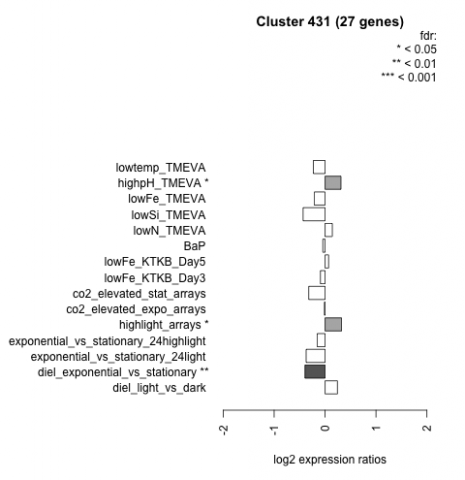
| Condition | Condition | Difference | FDR |
|---|---|---|---|
| BaP | BaP | -0.043 | 0.855 |
| co2_elevated_expo_arrays | co2_elevated_expo_arrays | -0.013 | 0.985 |
| co2_elevated_stat_arrays | co2_elevated_stat_arrays | -0.321 | 0.101 |
| diel_exponential_vs_stationary | diel_exponential_vs_stationary | -0.395 | 0.00732 |
| diel_light_vs_dark | diel_light_vs_dark | 0.243 | 0.171 |
| exponential_vs_stationary_24highlight | exponential_vs_stationary_24highlight | -0.155 | 0.0817 |
| exponential_vs_stationary_24light | exponential_vs_stationary_24light | -0.372 | 0.179 |
| highlight_arrays | highlight_arrays | 0.324 | 0.0168 |
| highpH_TMEVA | highpH_TMEVA | 0.313 | 0.0218 |
| lowFe_KTKB_Day3 | lowFe_KTKB_Day3 | -0.092 | 0.706 |
| lowFe_KTKB_Day5 | lowFe_KTKB_Day5 | 0.070 | 0.724 |
| lowFe_TMEVA | lowFe_TMEVA | -0.212 | 0.414 |
| lowN_TMEVA | lowN_TMEVA | 0.143 | 0.695 |
| lowSi_TMEVA | lowSi_TMEVA | -0.431 | 0.345 |
| lowtemp_TMEVA | lowtemp_TMEVA | -0.229 | 0.297 |