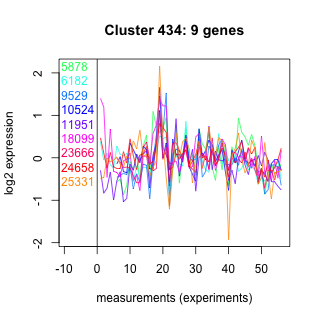
Thaps_hclust_0434 Hierarchical Clustering
Thalassiosira pseudonana
| Cluster Plot | Conditions Plot | Dendrogram |
|---|---|---|
 |
 |
 |
| GO ID | Go Term | p-value | q-value | Cluster |
|---|---|---|---|---|
| GO:0008152 | metabolism | 0.0841431 | 1 | Thaps_hclust_0434 |
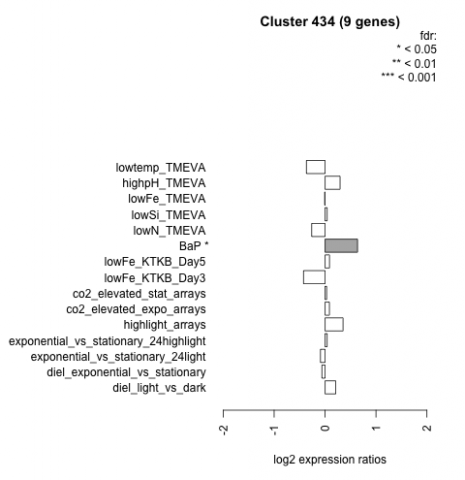
| Condition | Condition | Difference | FDR |
|---|---|---|---|
| diel_light_vs_dark | diel_light_vs_dark | 0.209 | 0.562 |
| lowFe_KTKB_Day3 | lowFe_KTKB_Day3 | -0.422 | 0.224 |
| lowFe_KTKB_Day5 | lowFe_KTKB_Day5 | 0.087 | 0.787 |
| BaP | BaP | 0.638 | 0.0421 |
| exponential_vs_stationary_24highlight | exponential_vs_stationary_24highlight | 0.040 | 0.827 |
| co2_elevated_stat_arrays | co2_elevated_stat_arrays | 0.031 | 0.928 |
| lowtemp_TMEVA | lowtemp_TMEVA | -0.365 | 0.321 |
| highpH_TMEVA | highpH_TMEVA | 0.295 | 0.183 |
| co2_elevated_expo_arrays | co2_elevated_expo_arrays | 0.086 | 0.833 |
| lowFe_TMEVA | lowFe_TMEVA | -0.007 | 0.996 |
| exponential_vs_stationary_24light | exponential_vs_stationary_24light | -0.091 | 0.869 |
| lowN_TMEVA | lowN_TMEVA | -0.263 | 0.564 |
| diel_exponential_vs_stationary | diel_exponential_vs_stationary | -0.061 | 0.857 |
| lowSi_TMEVA | lowSi_TMEVA | 0.040 | 1 |
| highlight_arrays | highlight_arrays | 0.354 | 0.129 |