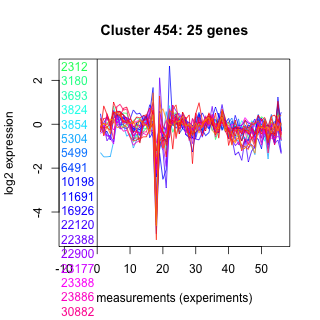
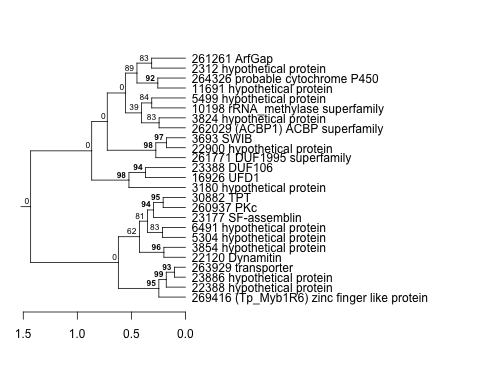
Thaps_hclust_0454 Hierarchical Clustering
Thalassiosira pseudonana
| Cluster Plot | Conditions Plot | Dendrogram |
|---|---|---|
 |
 |
 |
| GO ID | Go Term | p-value | q-value | Cluster |
|---|---|---|---|---|
| GO:0043087 | regulation of GTPase activity | 0.0123468 | 1 | Thaps_hclust_0454 |
| GO:0006811 | ion transport | 0.0221325 | 1 | Thaps_hclust_0454 |
| GO:0006511 | ubiquitin-dependent protein catabolism | 0.0616491 | 1 | Thaps_hclust_0454 |
| GO:0006810 | transport | 0.207702 | 1 | Thaps_hclust_0454 |
| GO:0006468 | protein amino acid phosphorylation | 0.236888 | 1 | Thaps_hclust_0454 |
| GO:0006355 | regulation of transcription, DNA-dependent | 0.325408 | 1 | Thaps_hclust_0454 |
|
2312 : hypothetical protein |
6491 : hypothetical protein |
22900 : hypothetical protein |
261261 : ArfGap |
|
3180 : hypothetical protein |
10198 : rRNA_methylase superfamily |
23177 : SF-assemblin |
261771 : DUF1995 superfamily |
|
3693 : SWIB |
11691 : hypothetical protein |
23388 : DUF106 |
262029 : (ACBP1) ACBP superfamily |
|
3824 : hypothetical protein |
16926 : UFD1 |
23886 : hypothetical protein |
263929 : transporter |
|
3854 : hypothetical protein |
22120 : Dynamitin |
30882 : TPT |
264326 : probable cytochrome P450 |
|
5304 : hypothetical protein |
22388 : hypothetical protein |
260937 : PKc |
269416 : (Tp_Myb1R6) zinc finger like protein |
|
5499 : hypothetical protein |
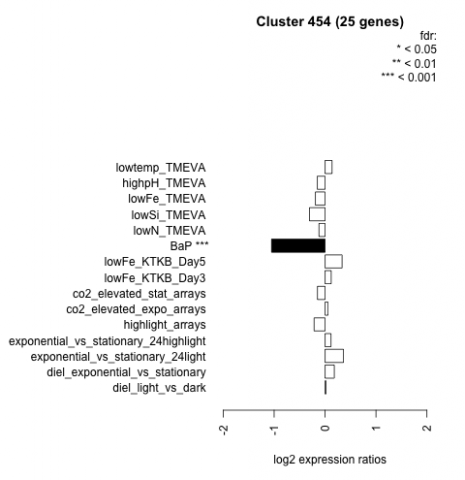
| Condition | Condition | Difference | FDR |
|---|---|---|---|
| diel_light_vs_dark | diel_light_vs_dark | 0.018 | 0.959 |
| lowFe_KTKB_Day3 | lowFe_KTKB_Day3 | 0.120 | 0.61 |
| lowFe_KTKB_Day5 | lowFe_KTKB_Day5 | 0.335 | 0.0506 |
| BaP | BaP | -1.050 | 0.00037 |
| exponential_vs_stationary_24highlight | exponential_vs_stationary_24highlight | 0.116 | 0.228 |
| co2_elevated_stat_arrays | co2_elevated_stat_arrays | -0.150 | 0.534 |
| lowtemp_TMEVA | lowtemp_TMEVA | 0.137 | 0.578 |
| highpH_TMEVA | highpH_TMEVA | -0.153 | 0.302 |
| co2_elevated_expo_arrays | co2_elevated_expo_arrays | 0.058 | 0.888 |
| lowFe_TMEVA | lowFe_TMEVA | -0.190 | 0.473 |
| exponential_vs_stationary_24light | exponential_vs_stationary_24light | 0.362 | 0.206 |
| lowN_TMEVA | lowN_TMEVA | -0.119 | 0.761 |
| diel_exponential_vs_stationary | diel_exponential_vs_stationary | 0.182 | 0.269 |
| lowSi_TMEVA | lowSi_TMEVA | -0.306 | 0.643 |
| highlight_arrays | highlight_arrays | -0.214 | 0.134 |