Thaps_hclust_0460 Hierarchical Clustering
Thalassiosira pseudonana
| Cluster Plot | Conditions Plot | Dendrogram |
|---|---|---|
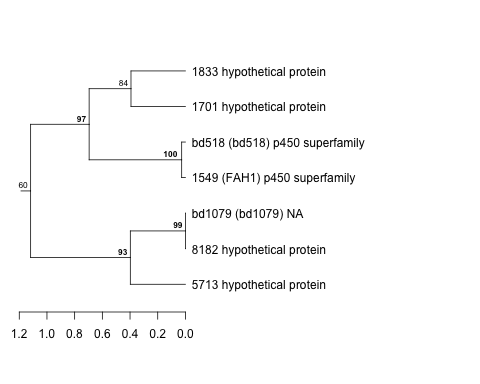
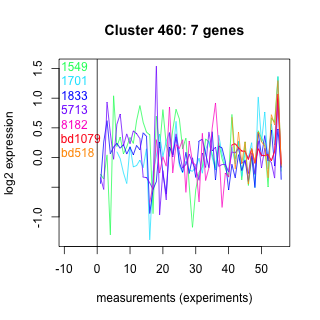 |
 |
 |
| GO ID | Go Term | p-value | q-value | Cluster |
|---|---|---|---|---|
| GO:0006118 | electron transport | 0.0549928 | 1 | Thaps_hclust_0460 |
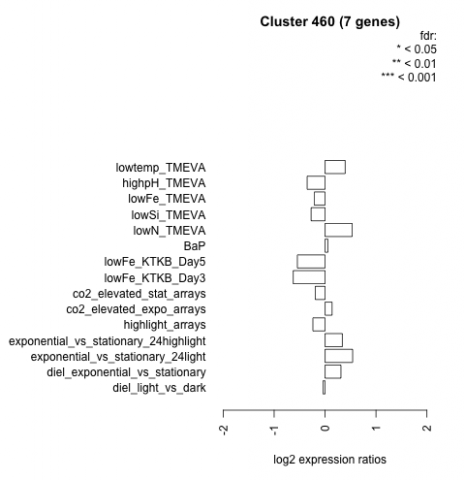
| Condition | Condition | Difference | FDR |
|---|---|---|---|
| diel_light_vs_dark | diel_light_vs_dark | -0.040 | 0.952 |
| lowFe_KTKB_Day3 | lowFe_KTKB_Day3 | -0.625 | 0.128 |
| lowFe_KTKB_Day5 | lowFe_KTKB_Day5 | -0.544 | 0.124 |
| BaP | BaP | 0.055 | 0.901 |
| exponential_vs_stationary_24highlight | exponential_vs_stationary_24highlight | 0.340 | 0.0574 |
| co2_elevated_stat_arrays | co2_elevated_stat_arrays | -0.192 | 0.573 |
| lowtemp_TMEVA | lowtemp_TMEVA | 0.396 | 0.331 |
| highpH_TMEVA | highpH_TMEVA | -0.352 | 0.165 |
| co2_elevated_expo_arrays | co2_elevated_expo_arrays | 0.137 | 0.686 |
| lowFe_TMEVA | lowFe_TMEVA | -0.212 | 0.622 |
| exponential_vs_stationary_24light | exponential_vs_stationary_24light | 0.542 | 0.272 |
| lowN_TMEVA | lowN_TMEVA | 0.533 | 0.279 |
| diel_exponential_vs_stationary | diel_exponential_vs_stationary | 0.312 | 0.306 |
| lowSi_TMEVA | lowSi_TMEVA | -0.274 | 0.806 |
| highlight_arrays | highlight_arrays | -0.239 | 0.375 |