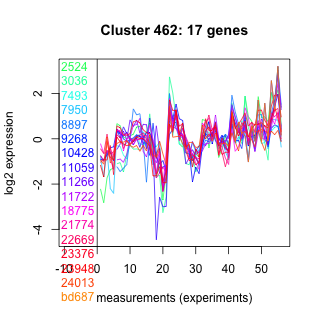
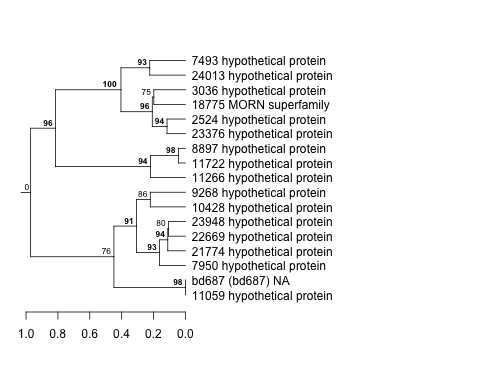
Thaps_hclust_0462 Hierarchical Clustering
Thalassiosira pseudonana
| Cluster Plot | Conditions Plot | Dendrogram |
|---|---|---|
 |
 |
 |
| GO ID | Go Term | p-value | q-value | Cluster |
|---|---|---|---|---|
| GO:0000074 | regulation of cell cycle | 0.000151336 | 0.546624 | Thaps_hclust_0462 |
|
2524 : hypothetical protein |
9268 : hypothetical protein |
11722 : hypothetical protein |
23376 : hypothetical protein |
|
3036 : hypothetical protein |
10428 : hypothetical protein |
18775 : MORN superfamily |
23948 : hypothetical protein |
|
7493 : hypothetical protein |
11059 : hypothetical protein |
21774 : hypothetical protein |
24013 : hypothetical protein |
|
7950 : hypothetical protein |
11266 : hypothetical protein |
22669 : hypothetical protein |
bd687 : (bd687) NA |
|
8897 : hypothetical protein |
| Condition | Condition | Difference | FDR |
|---|---|---|---|
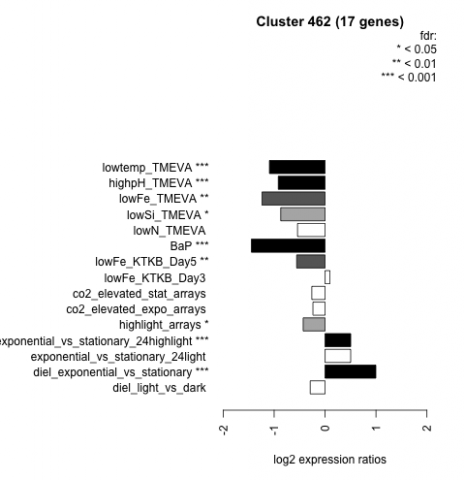
| diel_light_vs_dark | diel_light_vs_dark | -0.291 | 0.2 |
| lowFe_KTKB_Day3 | lowFe_KTKB_Day3 | 0.096 | 0.775 |
| lowFe_KTKB_Day5 | lowFe_KTKB_Day5 | -0.558 | 0.00948 |
| BaP | BaP | -1.450 | 0.00037 |
| exponential_vs_stationary_24highlight | exponential_vs_stationary_24highlight | 0.504 | 0.000526 |
| co2_elevated_stat_arrays | co2_elevated_stat_arrays | -0.260 | 0.292 |
| lowtemp_TMEVA | lowtemp_TMEVA | -1.090 | 0.000735 |
| highpH_TMEVA | highpH_TMEVA | -0.919 | 0.000725 |
| co2_elevated_expo_arrays | co2_elevated_expo_arrays | -0.238 | 0.129 |
| lowFe_TMEVA | lowFe_TMEVA | -1.240 | 0.00104 |
| exponential_vs_stationary_24light | exponential_vs_stationary_24light | 0.503 | 0.127 |
| lowN_TMEVA | lowN_TMEVA | -0.540 | 0.116 |
| diel_exponential_vs_stationary | diel_exponential_vs_stationary | 0.998 | 0.000602 |
| lowSi_TMEVA | lowSi_TMEVA | -0.871 | 0.0358 |
| highlight_arrays | highlight_arrays | -0.430 | 0.011 |