Thaps_hclust_0487 Hierarchical Clustering
Thalassiosira pseudonana
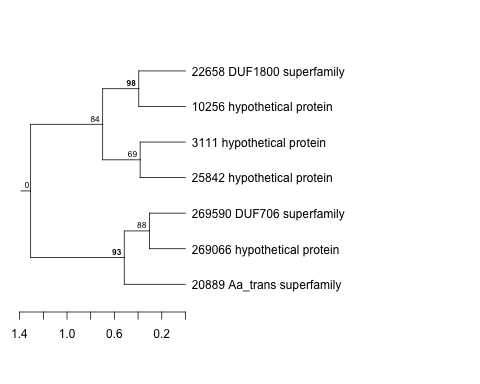
| Cluster Plot | Conditions Plot | Dendrogram |
|---|---|---|
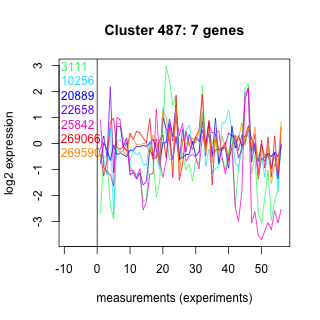 |
 |
 |
| GO ID | Go Term | p-value | q-value | Cluster |
|---|---|---|---|---|
| GO:0006030 | chitin metabolism | 0.0172587 | 1 | Thaps_hclust_0487 |
| GO:0006865 | amino acid transport | 0.0237743 | 1 | Thaps_hclust_0487 |
| GO:0007165 | signal transduction | 0.0326803 | 1 | Thaps_hclust_0487 |
| GO:0007242 | intracellular signaling cascade | 0.034293 | 1 | Thaps_hclust_0487 |
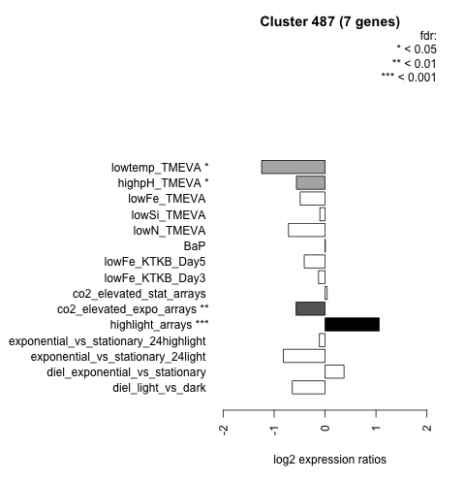
| Condition | Condition | Difference | FDR |
|---|---|---|---|
| lowtemp_TMEVA | lowtemp_TMEVA | -1.250 | 0.0165 |
| exponential_vs_stationary_24light | exponential_vs_stationary_24light | -0.818 | 0.101 |
| lowN_TMEVA | lowN_TMEVA | -0.718 | 0.157 |
| diel_light_vs_dark | diel_light_vs_dark | -0.644 | 0.0553 |
| co2_elevated_expo_arrays | co2_elevated_expo_arrays | -0.570 | 0.0087 |
| highpH_TMEVA | highpH_TMEVA | -0.563 | 0.0361 |
| lowFe_TMEVA | lowFe_TMEVA | -0.490 | 0.251 |
| lowFe_KTKB_Day5 | lowFe_KTKB_Day5 | -0.409 | 0.234 |
| lowFe_KTKB_Day3 | lowFe_KTKB_Day3 | -0.128 | 0.779 |
| exponential_vs_stationary_24highlight | exponential_vs_stationary_24highlight | -0.112 | 0.554 |
| lowSi_TMEVA | lowSi_TMEVA | -0.101 | 0.984 |
| BaP | BaP | 0.006 | 0.994 |
| co2_elevated_stat_arrays | co2_elevated_stat_arrays | 0.040 | 0.922 |
| diel_exponential_vs_stationary | diel_exponential_vs_stationary | 0.373 | 0.216 |
| highlight_arrays | highlight_arrays | 1.060 | 0.000442 |