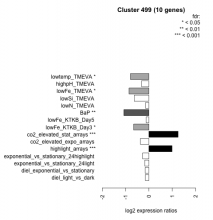
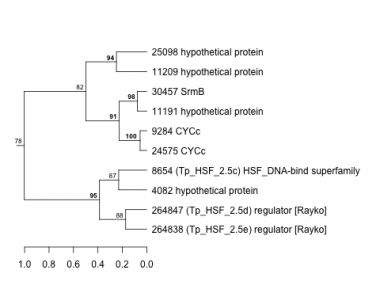
Thaps_hclust_0499 Hierarchical Clustering
Thalassiosira pseudonana
| GO ID | Go Term | p-value | q-value | Cluster |
|---|---|---|---|---|
| GO:0009190 | cyclic nucleotide biosynthesis | 0.000409077 | 1 | Thaps_hclust_0499 |
| GO:0007242 | intracellular signaling cascade | 0.00150381 | 1 | Thaps_hclust_0499 |
| GO:0006355 | regulation of transcription, DNA-dependent | 0.00731553 | 1 | Thaps_hclust_0499 |
| Condition | Condition | Difference | FDR |
|---|---|---|---|
| diel_light_vs_dark | diel_light_vs_dark | -0.156 | 0.668 |
| lowFe_KTKB_Day3 | lowFe_KTKB_Day3 | -0.655 | 0.0484 |
| lowFe_KTKB_Day5 | lowFe_KTKB_Day5 | -0.120 | 0.689 |
| BaP | BaP | -1.070 | 0.00103 |
| exponential_vs_stationary_24highlight | exponential_vs_stationary_24highlight | -0.267 | 0.0757 |
| co2_elevated_stat_arrays | co2_elevated_stat_arrays | 1.250 | 0.000658 |
| lowtemp_TMEVA | lowtemp_TMEVA | -0.791 | 0.0359 |
| highpH_TMEVA | highpH_TMEVA | -0.318 | 0.145 |
| co2_elevated_expo_arrays | co2_elevated_expo_arrays | -0.366 | 0.059 |
| lowFe_TMEVA | lowFe_TMEVA | -0.853 | 0.0195 |
| exponential_vs_stationary_24light | exponential_vs_stationary_24light | -0.176 | 0.728 |
| lowN_TMEVA | lowN_TMEVA | -0.141 | 0.761 |
| diel_exponential_vs_stationary | diel_exponential_vs_stationary | -0.159 | 0.555 |
| lowSi_TMEVA | lowSi_TMEVA | -0.630 | 0.298 |
| highlight_arrays | highlight_arrays | 0.993 | 0.000442 |


