Hierarchical Clusters
Displaying 1301 - 1400 of 28001
| Title | Cluster Plot | Dendrogram | e-value | e-value | e-value | Condition | Condition FDR | Condition Difference |
|---|---|---|---|---|---|---|---|---|
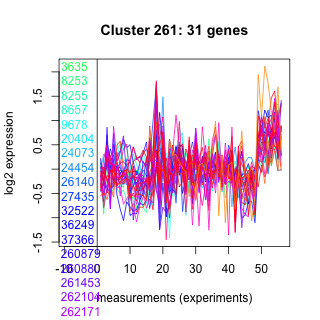
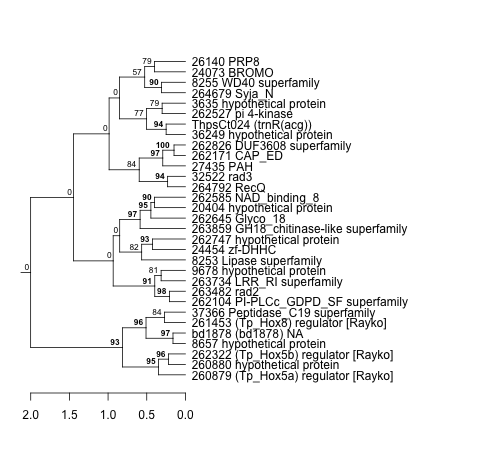
| Thaps_hclust_0261 |
 |
 |
0.00000000025 |
0.000000005 |
0.0000069 |
diel_light_vs_dark | 0.781000 | -0.063 |
| Thaps_hclust_0261 |
|
|
0.00000000025 |
0.000000005 |
0.0000069 |
lowFe_KTKB_Day3 | 0.936000 | -0.0189 |
| Thaps_hclust_0261 |
|
|
0.00000000025 |
0.000000005 |
0.0000069 |
lowFe_KTKB_Day5 | 0.884000 | -0.0282 |
| Thaps_hclust_0261 |
|
|
0.00000000025 |
0.000000005 |
0.0000069 |
BaP | 0.656000 | 0.086 |
| Thaps_hclust_0261 |
|
|
0.00000000025 |
0.000000005 |
0.0000069 |
exponential_vs_stationary_24highlight | 0.008460 | 0.228 |
| Thaps_hclust_0261 |
|
|
0.00000000025 |
0.000000005 |
0.0000069 |
co2_elevated_stat_arrays | 0.947000 | -0.0211 |
| Thaps_hclust_0261 |
|
|
0.00000000025 |
0.000000005 |
0.0000069 |
lowtemp_TMEVA | 0.872000 | 0.0392 |
| Thaps_hclust_0261 |
|
|
0.00000000025 |
0.000000005 |
0.0000069 |
highpH_TMEVA | 0.238000 | -0.158 |
| Thaps_hclust_0261 |
|
|
0.00000000025 |
0.000000005 |
0.0000069 |
co2_elevated_expo_arrays | 0.911000 | 0.0498 |
| Thaps_hclust_0261 |
|
|
0.00000000025 |
0.000000005 |
0.0000069 |
lowFe_TMEVA | 0.249000 | -0.272 |
| Thaps_hclust_0261 |
|
|
0.00000000025 |
0.000000005 |
0.0000069 |
exponential_vs_stationary_24light | 0.813000 | -0.0832 |
| Thaps_hclust_0261 |
|
|
0.00000000025 |
0.000000005 |
0.0000069 |
lowN_TMEVA | 0.808000 | 0.0873 |
| Thaps_hclust_0261 |
|
|
0.00000000025 |
0.000000005 |
0.0000069 |
diel_exponential_vs_stationary | 0.775000 | 0.0529 |
| Thaps_hclust_0261 |
|
|
0.00000000025 |
0.000000005 |
0.0000069 |
lowSi_TMEVA | 0.976000 | -0.127 |
| Thaps_hclust_0261 |
|
|
0.00000000025 |
0.000000005 |
0.0000069 |
highlight_arrays | 0.000442 | -0.861 |
| Title | Cluster Plot | Dendrogram | e-value | e-value | e-value | Condition | Condition FDR | Condition Difference |
|---|---|---|---|---|---|---|---|---|
| Thaps_hclust_0360 |
 |
 |
0.0000000013 |
0.0000000052 |
0.0000016 |
diel_light_vs_dark | 0.000485 | -0.673 |
| Thaps_hclust_0360 |
|
|
0.0000000013 |
0.0000000052 |
0.0000016 |
lowFe_KTKB_Day3 | 0.000862 | 0.774 |
| Thaps_hclust_0360 |
|
|
0.0000000013 |
0.0000000052 |
0.0000016 |
lowFe_KTKB_Day5 | 0.001320 | 1.72 |
| Thaps_hclust_0360 |
|
|
0.0000000013 |
0.0000000052 |
0.0000016 |
BaP | 0.311000 | 0.184 |
| Thaps_hclust_0360 |
|
|
0.0000000013 |
0.0000000052 |
0.0000016 |
exponential_vs_stationary_24highlight | 0.000526 | -1.24 |
| Thaps_hclust_0360 |
|
|
0.0000000013 |
0.0000000052 |
0.0000016 |
co2_elevated_stat_arrays | 0.000658 | 1.85 |
| Thaps_hclust_0360 |
|
|
0.0000000013 |
0.0000000052 |
0.0000016 |
lowtemp_TMEVA | 0.706000 | 0.0869 |
| Thaps_hclust_0360 |
|
|
0.0000000013 |
0.0000000052 |
0.0000016 |
highpH_TMEVA | 0.000725 | -0.434 |
| Thaps_hclust_0360 |
|
|
0.0000000013 |
0.0000000052 |
0.0000016 |
co2_elevated_expo_arrays | 0.001390 | -0.469 |
| Thaps_hclust_0360 |
|
|
0.0000000013 |
0.0000000052 |
0.0000016 |
lowFe_TMEVA | 0.072600 | -0.384 |
| Thaps_hclust_0360 |
|
|
0.0000000013 |
0.0000000052 |
0.0000016 |
exponential_vs_stationary_24light | 0.000581 | -1.73 |
| Thaps_hclust_0360 |
|
|
0.0000000013 |
0.0000000052 |
0.0000016 |
lowN_TMEVA | 0.015300 | 0.599 |
| Thaps_hclust_0360 |
|
|
0.0000000013 |
0.0000000052 |
0.0000016 |
diel_exponential_vs_stationary | 0.000602 | -1.72 |
| Thaps_hclust_0360 |
|
|
0.0000000013 |
0.0000000052 |
0.0000016 |
lowSi_TMEVA | 0.001350 | -1.29 |
| Thaps_hclust_0360 |
|
|
0.0000000013 |
0.0000000052 |
0.0000016 |
highlight_arrays | 0.000442 | 0.585 |
| Title | Cluster Plot | Dendrogram | e-value | e-value | e-value | Condition | Condition FDR | Condition Difference |
|---|---|---|---|---|---|---|---|---|
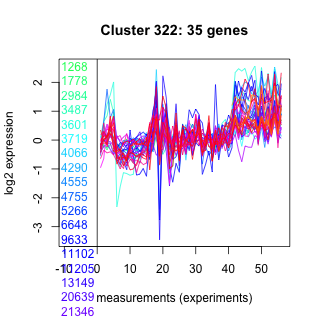
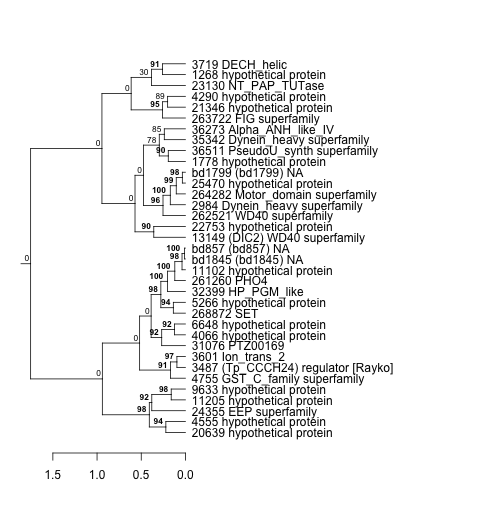
| Thaps_hclust_0322 |
 |
 |
0.0000000021 |
0.0000000053 |
0.0051 |
diel_light_vs_dark | 0.502000 | -0.124 |
| Thaps_hclust_0322 |
|
|
0.0000000021 |
0.0000000053 |
0.0051 |
lowFe_KTKB_Day3 | 0.736000 | -0.0767 |
| Thaps_hclust_0322 |
|
|
0.0000000021 |
0.0000000053 |
0.0051 |
lowFe_KTKB_Day5 | 0.146000 | 0.218 |
| Thaps_hclust_0322 |
|
|
0.0000000021 |
0.0000000053 |
0.0051 |
BaP | 0.042100 | 0.317 |
| Thaps_hclust_0322 |
|
|
0.0000000021 |
0.0000000053 |
0.0051 |
exponential_vs_stationary_24highlight | 0.030300 | -0.168 |
| Thaps_hclust_0322 |
|
|
0.0000000021 |
0.0000000053 |
0.0051 |
co2_elevated_stat_arrays | 0.506000 | -0.152 |
| Thaps_hclust_0322 |
|
|
0.0000000021 |
0.0000000053 |
0.0051 |
lowtemp_TMEVA | 0.264000 | 0.222 |
| Thaps_hclust_0322 |
|
|
0.0000000021 |
0.0000000053 |
0.0051 |
highpH_TMEVA | 0.036600 | -0.256 |
| Thaps_hclust_0322 |
|
|
0.0000000021 |
0.0000000053 |
0.0051 |
co2_elevated_expo_arrays | 0.441000 | 0.129 |
| Thaps_hclust_0322 |
|
|
0.0000000021 |
0.0000000053 |
0.0051 |
lowFe_TMEVA | 0.626000 | 0.14 |
| Thaps_hclust_0322 |
|
|
0.0000000021 |
0.0000000053 |
0.0051 |
exponential_vs_stationary_24light | 0.069700 | -0.439 |
| Thaps_hclust_0322 |
|
|
0.0000000021 |
0.0000000053 |
0.0051 |
lowN_TMEVA | 0.659000 | 0.155 |
| Thaps_hclust_0322 |
|
|
0.0000000021 |
0.0000000053 |
0.0051 |
diel_exponential_vs_stationary | 0.097900 | -0.217 |
| Thaps_hclust_0322 |
|
|
0.0000000021 |
0.0000000053 |
0.0051 |
lowSi_TMEVA | 0.450000 | 0.375 |
| Thaps_hclust_0322 |
|
|
0.0000000021 |
0.0000000053 |
0.0051 |
highlight_arrays | 0.896000 | -0.019 |
| Title | Cluster Plot | Dendrogram | e-value | e-value | e-value | Condition | Condition FDR | Condition Difference |
|---|---|---|---|---|---|---|---|---|
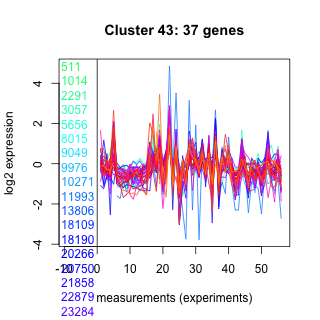
| Thaps_hclust_0043 |
 |
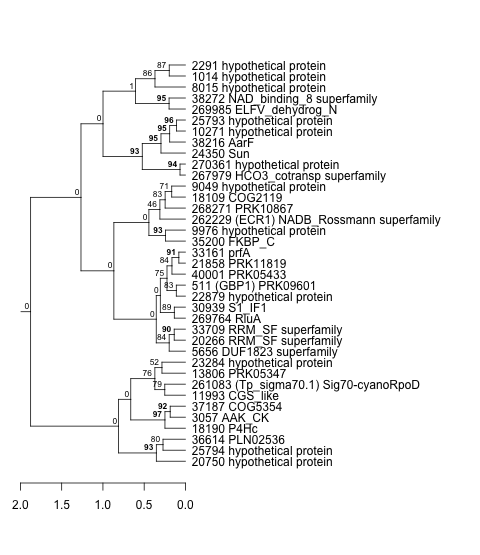 |
3.9e-18 |
0.0000000053 |
2 |
diel_light_vs_dark | 0.000485 | -1.07 |
| Thaps_hclust_0043 |
|
|
3.9e-18 |
0.0000000053 |
2 |
lowFe_KTKB_Day3 | 0.461000 | 0.139 |
| Thaps_hclust_0043 |
|
|
3.9e-18 |
0.0000000053 |
2 |
lowFe_KTKB_Day5 | 0.001320 | 0.376 |
| Thaps_hclust_0043 |
|
|
3.9e-18 |
0.0000000053 |
2 |
BaP | 0.930000 | 0.0173 |
| Thaps_hclust_0043 |
|
|
3.9e-18 |
0.0000000053 |
2 |
exponential_vs_stationary_24highlight | 0.106000 | 0.123 |
| Thaps_hclust_0043 |
|
|
3.9e-18 |
0.0000000053 |
2 |
co2_elevated_stat_arrays | 0.000658 | 0.548 |
| Thaps_hclust_0043 |
|
|
3.9e-18 |
0.0000000053 |
2 |
lowtemp_TMEVA | 0.000735 | 0.76 |
| Thaps_hclust_0043 |
|
|
3.9e-18 |
0.0000000053 |
2 |
highpH_TMEVA | 0.925000 | 0.0198 |
| Thaps_hclust_0043 |
|
|
3.9e-18 |
0.0000000053 |
2 |
co2_elevated_expo_arrays | 0.944000 | -0.0319 |
| Thaps_hclust_0043 |
|
|
3.9e-18 |
0.0000000053 |
2 |
lowFe_TMEVA | 0.331000 | -0.225 |
| Thaps_hclust_0043 |
|
|
3.9e-18 |
0.0000000053 |
2 |
exponential_vs_stationary_24light | 0.454000 | 0.208 |
| Thaps_hclust_0043 |
|
|
3.9e-18 |
0.0000000053 |
2 |
lowN_TMEVA | 0.489000 | -0.217 |
| Thaps_hclust_0043 |
|
|
3.9e-18 |
0.0000000053 |
2 |
diel_exponential_vs_stationary | 0.118000 | 0.201 |
| Thaps_hclust_0043 |
|
|
3.9e-18 |
0.0000000053 |
2 |
lowSi_TMEVA | 0.220000 | -0.462 |
| Thaps_hclust_0043 |
|
|
3.9e-18 |
0.0000000053 |
2 |
highlight_arrays | 0.232000 | -0.146 |
| Title | Cluster Plot | Dendrogram | e-value | e-value | e-value | Condition | Condition FDR | Condition Difference |
|---|---|---|---|---|---|---|---|---|
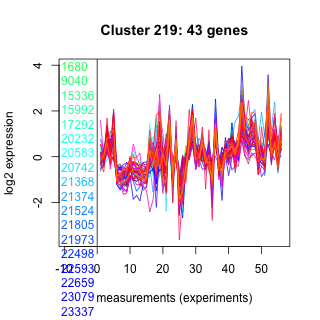
| Thaps_hclust_0219 |
 |
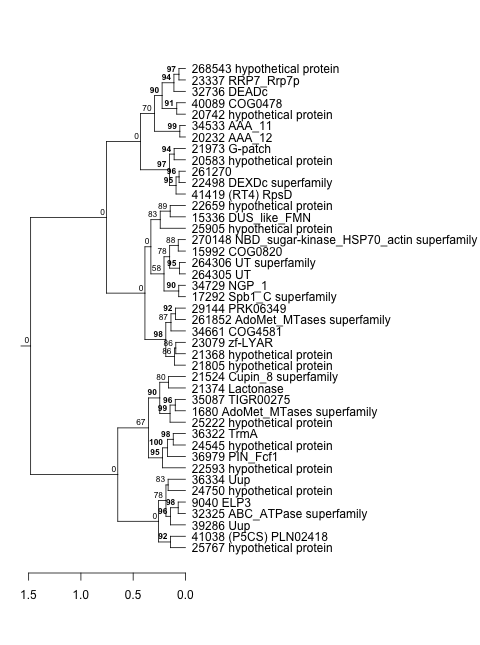 |
2.8e-16 |
0.0000000055 |
0.012 |
diel_light_vs_dark | 0.000485 | -0.558 |
| Thaps_hclust_0219 |
|
|
2.8e-16 |
0.0000000055 |
0.012 |
lowFe_KTKB_Day3 | 0.777000 | 0.0601 |
| Thaps_hclust_0219 |
|
|
2.8e-16 |
0.0000000055 |
0.012 |
lowFe_KTKB_Day5 | 0.685000 | -0.0618 |
| Thaps_hclust_0219 |
|
|
2.8e-16 |
0.0000000055 |
0.012 |
BaP | 0.979000 | 0.00613 |
| Thaps_hclust_0219 |
|
|
2.8e-16 |
0.0000000055 |
0.012 |
exponential_vs_stationary_24highlight | 0.000526 | -0.255 |
| Thaps_hclust_0219 |
|
|
2.8e-16 |
0.0000000055 |
0.012 |
co2_elevated_stat_arrays | 0.000658 | 0.994 |
| Thaps_hclust_0219 |
|
|
2.8e-16 |
0.0000000055 |
0.012 |
lowtemp_TMEVA | 0.000735 | 0.742 |
| Thaps_hclust_0219 |
|
|
2.8e-16 |
0.0000000055 |
0.012 |
highpH_TMEVA | 0.900000 | 0.0232 |
| Thaps_hclust_0219 |
|
|
2.8e-16 |
0.0000000055 |
0.012 |
co2_elevated_expo_arrays | 0.683000 | -0.0894 |
| Thaps_hclust_0219 |
|
|
2.8e-16 |
0.0000000055 |
0.012 |
lowFe_TMEVA | 0.940000 | -0.0341 |
| Thaps_hclust_0219 |
|
|
2.8e-16 |
0.0000000055 |
0.012 |
exponential_vs_stationary_24light | 0.000581 | -0.939 |
| Thaps_hclust_0219 |
|
|
2.8e-16 |
0.0000000055 |
0.012 |
lowN_TMEVA | 0.004000 | 0.623 |
| Thaps_hclust_0219 |
|
|
2.8e-16 |
0.0000000055 |
0.012 |
diel_exponential_vs_stationary | 0.015100 | -0.279 |
| Thaps_hclust_0219 |
|
|
2.8e-16 |
0.0000000055 |
0.012 |
lowSi_TMEVA | 0.839000 | 0.218 |
| Thaps_hclust_0219 |
|
|
2.8e-16 |
0.0000000055 |
0.012 |
highlight_arrays | 0.002290 | 0.326 |
| Title | Cluster Plot | Dendrogram | e-value | e-value | e-value | Condition | Condition FDR | Condition Difference |
|---|---|---|---|---|---|---|---|---|
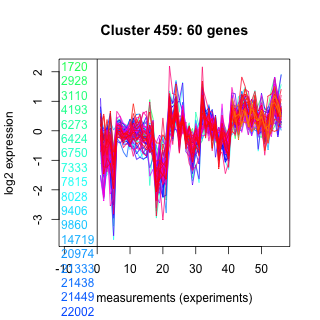
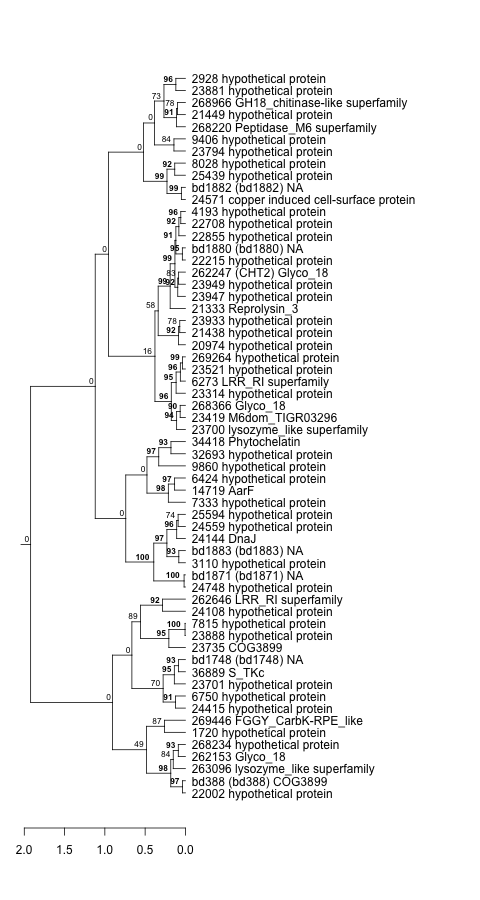
| Thaps_hclust_0459 |
 |
 |
0.00000000015 |
0.0000000056 |
0.000000015 |
diel_light_vs_dark | 0.000485 | -0.411 |
| Thaps_hclust_0459 |
|
|
0.00000000015 |
0.0000000056 |
0.000000015 |
lowFe_KTKB_Day3 | 0.010500 | -0.299 |
| Thaps_hclust_0459 |
|
|
0.00000000015 |
0.0000000056 |
0.000000015 |
lowFe_KTKB_Day5 | 0.001320 | -0.338 |
| Thaps_hclust_0459 |
|
|
0.00000000015 |
0.0000000056 |
0.000000015 |
BaP | 0.000370 | -1.39 |
| Thaps_hclust_0459 |
|
|
0.00000000015 |
0.0000000056 |
0.000000015 |
exponential_vs_stationary_24highlight | 0.986000 | 0.00134 |
| Thaps_hclust_0459 |
|
|
0.00000000015 |
0.0000000056 |
0.000000015 |
co2_elevated_stat_arrays | 0.733000 | -0.0933 |
| Thaps_hclust_0459 |
|
|
0.00000000015 |
0.0000000056 |
0.000000015 |
lowtemp_TMEVA | 0.000735 | -1.57 |
| Thaps_hclust_0459 |
|
|
0.00000000015 |
0.0000000056 |
0.000000015 |
highpH_TMEVA | 0.103000 | -0.163 |
| Thaps_hclust_0459 |
|
|
0.00000000015 |
0.0000000056 |
0.000000015 |
co2_elevated_expo_arrays | 0.098800 | -0.16 |
| Thaps_hclust_0459 |
|
|
0.00000000015 |
0.0000000056 |
0.000000015 |
lowFe_TMEVA | 0.001040 | -0.951 |
| Thaps_hclust_0459 |
|
|
0.00000000015 |
0.0000000056 |
0.000000015 |
exponential_vs_stationary_24light | 0.343000 | -0.216 |
| Thaps_hclust_0459 |
|
|
0.00000000015 |
0.0000000056 |
0.000000015 |
lowN_TMEVA | 0.019000 | -0.455 |
| Thaps_hclust_0459 |
|
|
0.00000000015 |
0.0000000056 |
0.000000015 |
diel_exponential_vs_stationary | 0.000602 | 0.719 |
| Thaps_hclust_0459 |
|
|
0.00000000015 |
0.0000000056 |
0.000000015 |
lowSi_TMEVA | 0.002330 | -0.657 |
| Thaps_hclust_0459 |
|
|
0.00000000015 |
0.0000000056 |
0.000000015 |
highlight_arrays | 0.391000 | 0.0892 |
| Title | Cluster Plot | Dendrogram | e-value | e-value | e-value | Condition | Condition FDR | Condition Difference |
|---|---|---|---|---|---|---|---|---|
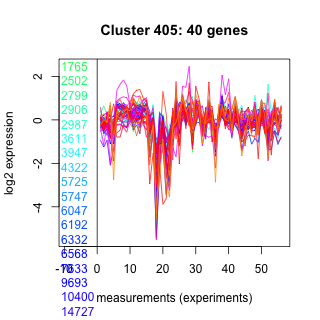
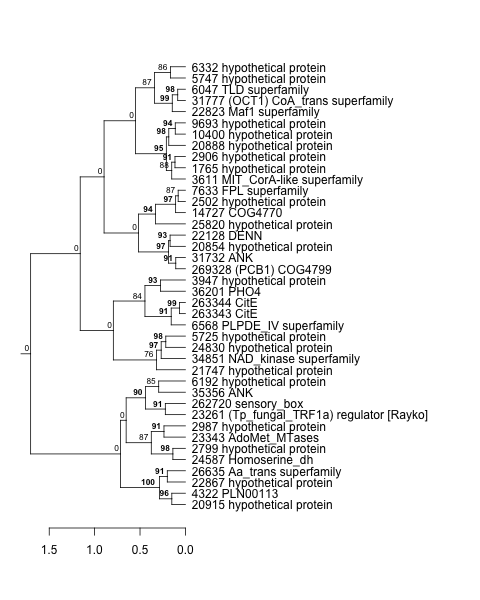
| Thaps_hclust_0405 |
 |
 |
0.00000000036 |
0.0000000063 |
0.005 |
diel_light_vs_dark | 0.919000 | -0.0258 |
| Thaps_hclust_0405 |
|
|
0.00000000036 |
0.0000000063 |
0.005 |
lowFe_KTKB_Day3 | 0.000862 | -0.518 |
| Thaps_hclust_0405 |
|
|
0.00000000036 |
0.0000000063 |
0.005 |
lowFe_KTKB_Day5 | 0.300000 | -0.15 |
| Thaps_hclust_0405 |
|
|
0.00000000036 |
0.0000000063 |
0.005 |
BaP | 0.000370 | -1.48 |
| Thaps_hclust_0405 |
|
|
0.00000000036 |
0.0000000063 |
0.005 |
exponential_vs_stationary_24highlight | 0.122000 | -0.114 |
| Thaps_hclust_0405 |
|
|
0.00000000036 |
0.0000000063 |
0.005 |
co2_elevated_stat_arrays | 0.011200 | -0.386 |
| Thaps_hclust_0405 |
|
|
0.00000000036 |
0.0000000063 |
0.005 |
lowtemp_TMEVA | 0.003800 | -0.521 |
| Thaps_hclust_0405 |
|
|
0.00000000036 |
0.0000000063 |
0.005 |
highpH_TMEVA | 0.281000 | -0.133 |
| Thaps_hclust_0405 |
|
|
0.00000000036 |
0.0000000063 |
0.005 |
co2_elevated_expo_arrays | 0.873000 | 0.0584 |
| Thaps_hclust_0405 |
|
|
0.00000000036 |
0.0000000063 |
0.005 |
lowFe_TMEVA | 0.218000 | -0.266 |