Hierarchical Clusters
Displaying 401 - 500 of 7500
| Title | Cluster Plot | Dendrogram | e-value | e-value | e-value | Condition | Condition FDR | Condition Difference |
|---|---|---|---|---|---|---|---|---|
| Thaps_hclust_0230 |
 |
|
|
1.1e-30 |
0.0000000000029 |
lowN_TMEVA | 0.001190 | 0.459 |
| Thaps_hclust_0230 |
|
|
|
1.1e-30 |
0.0000000000029 |
diel_exponential_vs_stationary | 0.006360 | -0.192 |
| Thaps_hclust_0230 |
|
|
|
1.1e-30 |
0.0000000000029 |
lowSi_TMEVA | 0.402000 | 0.31 |
| Thaps_hclust_0230 |
|
|
|
1.1e-30 |
0.0000000000029 |
highlight_arrays | 0.656000 | 0.0409 |
| Thaps_hclust_0230 |
|
|
|
1.1e-30 |
0.0000000000029 |
diel_light_vs_dark | 0.000485 | -0.306 |
| Title | Cluster Plot | Dendrogram | e-value | e-value | e-value | Condition | Condition FDR | Condition Difference |
|---|---|---|---|---|---|---|---|---|
| Thaps_hclust_0052 |
 |
 |
1.4e-22 |
3.3e-19 |
0.0000000000037 |
exponential_vs_stationary_24light | 0.002150 | 0.664 |
| Thaps_hclust_0052 |
|
|
1.4e-22 |
3.3e-19 |
0.0000000000037 |
lowN_TMEVA | 0.037200 | -0.464 |
| Thaps_hclust_0052 |
|
|
1.4e-22 |
3.3e-19 |
0.0000000000037 |
diel_exponential_vs_stationary | 0.001110 | 0.366 |
| Thaps_hclust_0052 |
|
|
1.4e-22 |
3.3e-19 |
0.0000000000037 |
lowSi_TMEVA | 0.091400 | -0.526 |
| Thaps_hclust_0052 |
|
|
1.4e-22 |
3.3e-19 |
0.0000000000037 |
highlight_arrays | 0.002540 | -0.308 |
| Thaps_hclust_0052 |
|
|
1.4e-22 |
3.3e-19 |
0.0000000000037 |
diel_light_vs_dark | 0.000926 | -0.449 |
| Thaps_hclust_0052 |
|
|
1.4e-22 |
3.3e-19 |
0.0000000000037 |
lowFe_KTKB_Day3 | 0.002990 | 0.429 |
| Thaps_hclust_0052 |
|
|
1.4e-22 |
3.3e-19 |
0.0000000000037 |
lowFe_KTKB_Day5 | 0.017400 | 0.307 |
| Thaps_hclust_0052 |
|
|
1.4e-22 |
3.3e-19 |
0.0000000000037 |
BaP | 0.000370 | 0.974 |
| Thaps_hclust_0052 |
|
|
1.4e-22 |
3.3e-19 |
0.0000000000037 |
exponential_vs_stationary_24highlight | 0.000526 | 0.247 |
| Thaps_hclust_0052 |
|
|
1.4e-22 |
3.3e-19 |
0.0000000000037 |
co2_elevated_stat_arrays | 0.048700 | 0.324 |
| Thaps_hclust_0052 |
|
|
1.4e-22 |
3.3e-19 |
0.0000000000037 |
lowtemp_TMEVA | 0.000735 | 0.661 |
| Thaps_hclust_0052 |
|
|
1.4e-22 |
3.3e-19 |
0.0000000000037 |
highpH_TMEVA | 0.021700 | 0.257 |
| Thaps_hclust_0052 |
|
|
1.4e-22 |
3.3e-19 |
0.0000000000037 |
co2_elevated_expo_arrays | 1.000000 | 0.00058 |
| Thaps_hclust_0052 |
|
|
1.4e-22 |
3.3e-19 |
0.0000000000037 |
lowFe_TMEVA | 0.911000 | -0.0426 |
| Title | Cluster Plot | Dendrogram | e-value | e-value | e-value | Condition | Condition FDR | Condition Difference |
|---|---|---|---|---|---|---|---|---|
| Thaps_hclust_0062 |
 |
 |
0.000000026 |
0.000000021 |
0.000000000021 |
lowtemp_TMEVA | 1.000000 | |
| Thaps_hclust_0062 |
|
|
0.000000026 |
0.000000021 |
0.000000000021 |
highpH_TMEVA | 1.000000 | |
| Thaps_hclust_0062 |
|
|
0.000000026 |
0.000000021 |
0.000000000021 |
co2_elevated_expo_arrays | 0.001390 | 0.718 |
| Thaps_hclust_0062 |
|
|
0.000000026 |
0.000000021 |
0.000000000021 |
lowFe_TMEVA | 1.000000 | |
| Thaps_hclust_0062 |
|
|
0.000000026 |
0.000000021 |
0.000000000021 |
exponential_vs_stationary_24light | 0.829000 | 0.137 |
| Thaps_hclust_0062 |
|
|
0.000000026 |
0.000000021 |
0.000000000021 |
lowN_TMEVA | 1.000000 | |
| Thaps_hclust_0062 |
|
|
0.000000026 |
0.000000021 |
0.000000000021 |
diel_exponential_vs_stationary | 0.493000 | 0.232 |
| Thaps_hclust_0062 |
|
|
0.000000026 |
0.000000021 |
0.000000000021 |
lowSi_TMEVA | 1.000000 | |
| Thaps_hclust_0062 |
|
|
0.000000026 |
0.000000021 |
0.000000000021 |
highlight_arrays | 0.074100 | -0.513 |
| Thaps_hclust_0062 |
|
|
0.000000026 |
0.000000021 |
0.000000000021 |
diel_light_vs_dark | 0.003420 | -1.09 |
| Thaps_hclust_0062 |
|
|
0.000000026 |
0.000000021 |
0.000000000021 |
lowFe_KTKB_Day3 | 1.000000 | |
| Thaps_hclust_0062 |
|
|
0.000000026 |
0.000000021 |
0.000000000021 |
lowFe_KTKB_Day5 | 1.000000 | |
| Thaps_hclust_0062 |
|
|
0.000000026 |
0.000000021 |
0.000000000021 |
BaP | 1.000000 | |
| Thaps_hclust_0062 |
|
|
0.000000026 |
0.000000021 |
0.000000000021 |
exponential_vs_stationary_24highlight | 0.832000 | 0.047 |
| Thaps_hclust_0062 |
|
|
0.000000026 |
0.000000021 |
0.000000000021 |
co2_elevated_stat_arrays | 0.000658 | 1.37 |
| Title | Cluster Plot | Dendrogram | e-value | e-value | e-value | Condition | Condition FDR | Condition Difference |
|---|---|---|---|---|---|---|---|---|
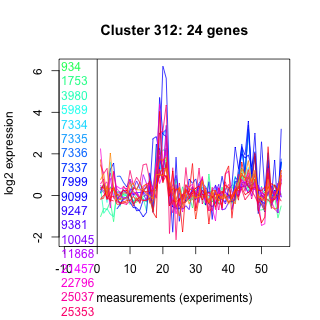
| Thaps_hclust_0312 |
 |
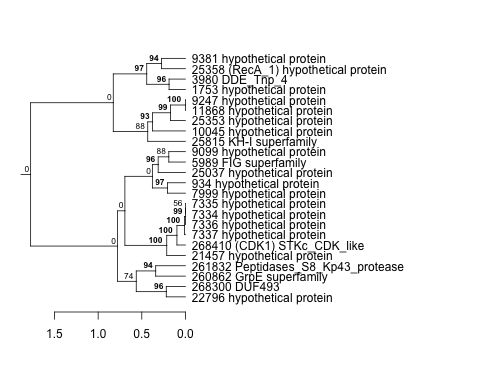 |
1.6e-19 |
9.9e-16 |
0.000000000033 |
lowN_TMEVA | 0.861000 | 0.0571 |
| Thaps_hclust_0312 |
|
|
1.6e-19 |
9.9e-16 |
0.000000000033 |
diel_exponential_vs_stationary | 0.441000 | -0.139 |
| Thaps_hclust_0312 |
|
|
1.6e-19 |
9.9e-16 |
0.000000000033 |
lowSi_TMEVA | 0.599000 | 0.334 |
| Thaps_hclust_0312 |
|
|
1.6e-19 |
9.9e-16 |
0.000000000033 |
highlight_arrays | 0.000442 | 0.559 |
| Thaps_hclust_0312 |
|
|
1.6e-19 |
9.9e-16 |
0.000000000033 |
diel_light_vs_dark | 0.785000 | 0.0722 |
| Thaps_hclust_0312 |
|
|
1.6e-19 |
9.9e-16 |
0.000000000033 |
lowFe_KTKB_Day3 | 0.157000 | 0.299 |
| Thaps_hclust_0312 |
|
|
1.6e-19 |
9.9e-16 |
0.000000000033 |
lowFe_KTKB_Day5 | 0.954000 | -0.014 |
| Thaps_hclust_0312 |
|
|
1.6e-19 |
9.9e-16 |
0.000000000033 |
BaP | 0.000370 | 1.75 |
| Thaps_hclust_0312 |
|
|
1.6e-19 |
9.9e-16 |
0.000000000033 |
exponential_vs_stationary_24highlight | 0.000526 | -0.59 |
| Thaps_hclust_0312 |
|
|
1.6e-19 |
9.9e-16 |
0.000000000033 |
co2_elevated_stat_arrays | 0.002130 | 0.596 |
| Thaps_hclust_0312 |
|
|
1.6e-19 |
9.9e-16 |
0.000000000033 |
lowtemp_TMEVA | 0.385000 | 0.208 |
| Thaps_hclust_0312 |
|
|
1.6e-19 |
9.9e-16 |
0.000000000033 |
highpH_TMEVA | 0.000725 | 0.497 |
| Thaps_hclust_0312 |
|
|
1.6e-19 |
9.9e-16 |
0.000000000033 |
co2_elevated_expo_arrays | 0.660000 | 0.106 |
| Thaps_hclust_0312 |
|
|
1.6e-19 |
9.9e-16 |
0.000000000033 |
lowFe_TMEVA | 0.249000 | 0.296 |
| Thaps_hclust_0312 |
|
|
1.6e-19 |
9.9e-16 |
0.000000000033 |
exponential_vs_stationary_24light | 0.019000 | -0.641 |
| Title | Cluster Plot | Dendrogram | e-value | e-value | e-value | Condition | Condition FDR | Condition Difference |
|---|---|---|---|---|---|---|---|---|
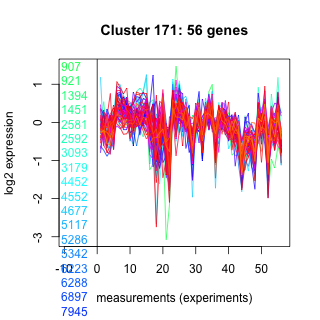
| Thaps_hclust_0171 |
 |
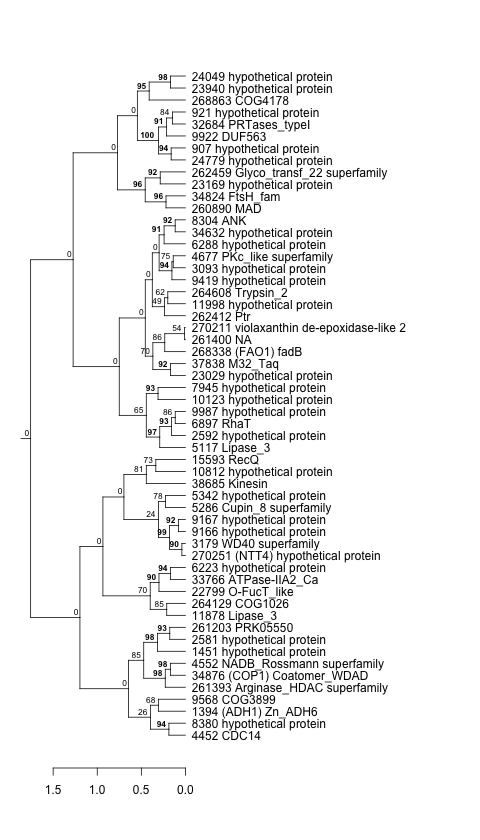 |
0.0000000000052 |
0.000000000056 |
0.000000000083 |
co2_elevated_stat_arrays | 0.000658 | -0.61 |
| Thaps_hclust_0171 |
|
|
0.0000000000052 |
0.000000000056 |
0.000000000083 |
lowtemp_TMEVA | 0.599000 | -0.09 |
| Thaps_hclust_0171 |
|
|
0.0000000000052 |
0.000000000056 |
0.000000000083 |
highpH_TMEVA | 0.283000 | -0.116 |
| Thaps_hclust_0171 |
|
|
0.0000000000052 |
0.000000000056 |
0.000000000083 |
co2_elevated_expo_arrays | 0.985000 | 0.00856 |
| Thaps_hclust_0171 |
|
|
0.0000000000052 |
0.000000000056 |
0.000000000083 |
lowFe_TMEVA | 0.508000 | -0.156 |
| Thaps_hclust_0171 |
|
|
0.0000000000052 |
0.000000000056 |
0.000000000083 |
exponential_vs_stationary_24light | 0.000581 | 0.587 |
| Thaps_hclust_0171 |
|
|
0.0000000000052 |
0.000000000056 |
0.000000000083 |
lowN_TMEVA | 0.279000 | -0.267 |
| Thaps_hclust_0171 |
|
|
0.0000000000052 |
0.000000000056 |
0.000000000083 |
diel_exponential_vs_stationary | 0.618000 | 0.0629 |
| Thaps_hclust_0171 |
|
|
0.0000000000052 |
0.000000000056 |
0.000000000083 |
lowSi_TMEVA | 0.895000 | -0.196 |
| Thaps_hclust_0171 |
|
|
0.0000000000052 |
0.000000000056 |
0.000000000083 |
highlight_arrays | 0.000442 | -0.364 |
| Thaps_hclust_0171 |
|
|
0.0000000000052 |
0.000000000056 |
0.000000000083 |
diel_light_vs_dark | 0.060500 | 0.219 |
| Thaps_hclust_0171 |
|
|
0.0000000000052 |
0.000000000056 |
0.000000000083 |
lowFe_KTKB_Day3 | 0.308000 | -0.147 |
| Thaps_hclust_0171 |
|
|
0.0000000000052 |
0.000000000056 |
0.000000000083 |
lowFe_KTKB_Day5 | 0.124000 | -0.18 |
| Thaps_hclust_0171 |
|
|
0.0000000000052 |
0.000000000056 |
0.000000000083 |
BaP | 0.001320 | -0.399 |
| Thaps_hclust_0171 |
|
|
0.0000000000052 |
0.000000000056 |
0.000000000083 |
exponential_vs_stationary_24highlight | 0.000526 | 0.287 |
| Title | Cluster Plot | Dendrogram | e-value | e-value | e-value | Condition | Condition FDR | Condition Difference |
|---|---|---|---|---|---|---|---|---|
| Thaps_hclust_0302 |
 |
 |
0.000000015 |
0.00000024 |
0.00000000039 |
lowFe_KTKB_Day5 | 0.025300 | 0.317 |
| Thaps_hclust_0302 |
|
|
0.000000015 |
0.00000024 |
0.00000000039 |
BaP | 0.000370 | 0.562 |
| Thaps_hclust_0302 |
|
|
0.000000015 |
0.00000024 |
0.00000000039 |
exponential_vs_stationary_24highlight | 0.000526 | -0.464 |
| Thaps_hclust_0302 |
|
|
0.000000015 |
0.00000024 |
0.00000000039 |
co2_elevated_stat_arrays | 0.000658 | 0.526 |
| Thaps_hclust_0302 |
|
|
0.000000015 |
0.00000024 |
0.00000000039 |
lowtemp_TMEVA | 0.078400 | 0.347 |
| Thaps_hclust_0302 |
|
|
0.000000015 |
0.00000024 |
0.00000000039 |
highpH_TMEVA | 0.000725 | 0.366 |
| Thaps_hclust_0302 |
|
|
0.000000015 |
0.00000024 |
0.00000000039 |
co2_elevated_expo_arrays | 0.736000 | -0.0863 |
| Thaps_hclust_0302 |
|
|
0.000000015 |
0.00000024 |
0.00000000039 |
lowFe_TMEVA | 0.001040 | 1.54 |
| Thaps_hclust_0302 |
|
|
0.000000015 |
0.00000024 |
0.00000000039 |
exponential_vs_stationary_24light | 0.000581 | -1.45 |
| Thaps_hclust_0302 |
|
|
0.000000015 |
0.00000024 |
0.00000000039 |
lowN_TMEVA | 0.789000 | 0.0956 |
| Thaps_hclust_0302 |
|
|
0.000000015 |
0.00000024 |
0.00000000039 |
diel_exponential_vs_stationary | 0.122000 | -0.205 |
| Thaps_hclust_0302 |
|
|
0.000000015 |
0.00000024 |
0.00000000039 |
lowSi_TMEVA | 0.001350 | 2.44 |
| Thaps_hclust_0302 |
|
|
0.000000015 |
0.00000024 |
0.00000000039 |
highlight_arrays | 0.000442 | 0.486 |
| Thaps_hclust_0302 |
|
|
0.000000015 |
0.00000024 |
0.00000000039 |
diel_light_vs_dark | 0.703000 | -0.0782 |
| Thaps_hclust_0302 |
|
|
0.000000015 |
0.00000024 |
0.00000000039 |
lowFe_KTKB_Day3 | 0.702000 | -0.083 |
| Title | Cluster Plot | Dendrogram | e-value | e-value | e-value | Condition | Condition FDR | Condition Difference |
|---|---|---|---|---|---|---|---|---|
| Thaps_hclust_0029 |
 |
|
9.1e-19 |
4.9e-16 |
0.00000000044 |
diel_light_vs_dark | 0.557000 | -0.0749 |
| Thaps_hclust_0029 |
|
|
9.1e-19 |
4.9e-16 |
0.00000000044 |
lowFe_KTKB_Day3 | 0.000862 | 0.439 |
| Thaps_hclust_0029 |
|
|
9.1e-19 |
4.9e-16 |
0.00000000044 |
lowFe_KTKB_Day5 | 0.240000 | 0.119 |
| Thaps_hclust_0029 |
|
|
9.1e-19 |
4.9e-16 |
0.00000000044 |
BaP | 0.612000 | -0.0618 |
| Thaps_hclust_0029 |
|
|
9.1e-19 |
4.9e-16 |
0.00000000044 |
exponential_vs_stationary_24highlight | 0.000526 | 0.591 |
| Thaps_hclust_0029 |
|
|
9.1e-19 |
4.9e-16 |
0.00000000044 |
co2_elevated_stat_arrays | 0.838000 | 0.07 |
| Thaps_hclust_0029 |
|
|
9.1e-19 |
4.9e-16 |
0.00000000044 |
lowtemp_TMEVA | 0.015200 | 0.307 |
| Thaps_hclust_0029 |
|
|
9.1e-19 |
4.9e-16 |
0.00000000044 |
highpH_TMEVA | 0.555000 | -0.0651 |
| Thaps_hclust_0029 |
|
|
9.1e-19 |
4.9e-16 |
0.00000000044 |
co2_elevated_expo_arrays | 0.487000 | 0.101 |
| Thaps_hclust_0029 |
|
|
9.1e-19 |
4.9e-16 |
0.00000000044 |
lowFe_TMEVA | 0.001040 | -0.5 |
| Thaps_hclust_0029 |
|
|
9.1e-19 |
4.9e-16 |
0.00000000044 |
exponential_vs_stationary_24light | 0.000581 | 1.85 |
| Thaps_hclust_0029 |
|
|
9.1e-19 |
4.9e-16 |
0.00000000044 |
lowN_TMEVA | 0.001190 | -1.31 |
| Thaps_hclust_0029 |
|
|
9.1e-19 |
4.9e-16 |
0.00000000044 |
diel_exponential_vs_stationary | 0.000602 | 1.12 |
| Thaps_hclust_0029 |
|
|
9.1e-19 |
4.9e-16 |
0.00000000044 |
lowSi_TMEVA | 0.001350 | -1.16 |
| Thaps_hclust_0029 |
|
|
9.1e-19 |
4.9e-16 |
0.00000000044 |
highlight_arrays | 0.000442 | -0.866 |
| Title | Cluster Plot | Dendrogram | e-value | e-value | e-value | Condition | Condition FDR | Condition Difference |
|---|---|---|---|---|---|---|---|---|
| Thaps_hclust_0040 |
 |
 |
1.8e-29 |
0.000000000042 |
0.00000000063 |
BaP | 1.000000 | |
| Thaps_hclust_0040 |
|
|
1.8e-29 |
0.000000000042 |
0.00000000063 |
exponential_vs_stationary_24highlight | 0.000526 | 0.348 |
| Thaps_hclust_0040 |
|
|
1.8e-29 |
0.000000000042 |
0.00000000063 |
co2_elevated_stat_arrays | 0.000658 | 0.54 |
| Thaps_hclust_0040 |
|
|
1.8e-29 |
0.000000000042 |
0.00000000063 |
lowtemp_TMEVA | 1.000000 | |
| Thaps_hclust_0040 |
|
|
1.8e-29 |
0.000000000042 |
0.00000000063 |
highpH_TMEVA | 1.000000 |