Hierarchical Clusters
Displaying 1001 - 1100 of 7500
| Title | Cluster Plot | Dendrogram | e-value | e-value | e-value | Condition | Condition FDR | Condition Difference |
|---|---|---|---|---|---|---|---|---|
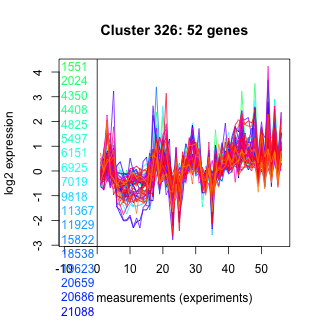
| Thaps_hclust_0326 |
 |
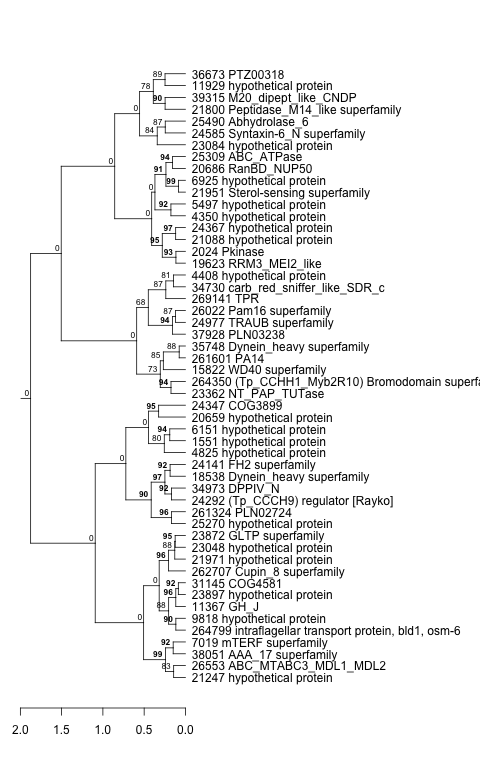 |
0.000000000000042 |
0.00000000011 |
0.00000051 |
co2_elevated_stat_arrays | 0.075700 | 0.277 |
| Thaps_hclust_0326 |
|
|
0.000000000000042 |
0.00000000011 |
0.00000051 |
lowtemp_TMEVA | 0.229000 | 0.199 |
| Thaps_hclust_0326 |
|
|
0.000000000000042 |
0.00000000011 |
0.00000051 |
highpH_TMEVA | 0.204000 | -0.139 |
| Thaps_hclust_0326 |
|
|
0.000000000000042 |
0.00000000011 |
0.00000051 |
co2_elevated_expo_arrays | 0.944000 | 0.0372 |
| Thaps_hclust_0326 |
|
|
0.000000000000042 |
0.00000000011 |
0.00000051 |
lowFe_TMEVA | 0.996000 | 0.00495 |
| Title | Cluster Plot | Dendrogram | e-value | e-value | e-value | Condition | Condition FDR | Condition Difference |
|---|---|---|---|---|---|---|---|---|
| Thaps_hclust_0087 |
 |
 |
0.00000000000011 |
0.000026 |
0.028 |
exponential_vs_stationary_24light | 0.000581 | 1.03 |
| Thaps_hclust_0087 |
|
|
0.00000000000011 |
0.000026 |
0.028 |
co2_elevated_stat_arrays | 0.801000 | -0.07 |
| Thaps_hclust_0087 |
|
|
0.00000000000011 |
0.000026 |
0.028 |
lowN_TMEVA | 0.097700 | -0.436 |
| Thaps_hclust_0087 |
|
|
0.00000000000011 |
0.000026 |
0.028 |
diel_exponential_vs_stationary | 0.699000 | 0.0688 |
| Thaps_hclust_0087 |
|
|
0.00000000000011 |
0.000026 |
0.028 |
lowSi_TMEVA | 1.000000 | -0.071 |
| Thaps_hclust_0087 |
|
|
0.00000000000011 |
0.000026 |
0.028 |
highlight_arrays | 0.000442 | -0.639 |
| Thaps_hclust_0087 |
|
|
0.00000000000011 |
0.000026 |
0.028 |
diel_light_vs_dark | 0.000485 | 1.25 |
| Thaps_hclust_0087 |
|
|
0.00000000000011 |
0.000026 |
0.028 |
lowtemp_TMEVA | 0.063900 | 0.372 |
| Thaps_hclust_0087 |
|
|
0.00000000000011 |
0.000026 |
0.028 |
lowFe_KTKB_Day3 | 0.604000 | 0.111 |
| Thaps_hclust_0087 |
|
|
0.00000000000011 |
0.000026 |
0.028 |
highpH_TMEVA | 0.000725 | -0.475 |
| Thaps_hclust_0087 |
|
|
0.00000000000011 |
0.000026 |
0.028 |
lowFe_KTKB_Day5 | 0.496000 | -0.119 |
| Thaps_hclust_0087 |
|
|
0.00000000000011 |
0.000026 |
0.028 |
co2_elevated_expo_arrays | 0.006820 | 0.295 |
| Thaps_hclust_0087 |
|
|
0.00000000000011 |
0.000026 |
0.028 |
BaP | 0.073200 | -0.295 |
| Thaps_hclust_0087 |
|
|
0.00000000000011 |
0.000026 |
0.028 |
lowFe_TMEVA | 0.218000 | 0.289 |
| Thaps_hclust_0087 |
|
|
0.00000000000011 |
0.000026 |
0.028 |
exponential_vs_stationary_24highlight | 0.554000 | 0.0557 |
| Title | Cluster Plot | Dendrogram | e-value | e-value | e-value | Condition | Condition FDR | Condition Difference |
|---|---|---|---|---|---|---|---|---|
| Thaps_hclust_0117 |
 |
 |
0.0000000000002 |
0.000000021 |
0.00000045 |
lowtemp_TMEVA | 0.036400 | -0.548 |
| Thaps_hclust_0117 |
|
|
0.0000000000002 |
0.000000021 |
0.00000045 |
highpH_TMEVA | 0.000725 | 1.23 |
| Thaps_hclust_0117 |
|
|
0.0000000000002 |
0.000000021 |
0.00000045 |
co2_elevated_expo_arrays | 0.001390 | 0.788 |
| Thaps_hclust_0117 |
|
|
0.0000000000002 |
0.000000021 |
0.00000045 |
lowFe_TMEVA | 0.001040 | 0.941 |
| Thaps_hclust_0117 |
|
|
0.0000000000002 |
0.000000021 |
0.00000045 |
exponential_vs_stationary_24light | 0.000581 | -2.19 |
| Thaps_hclust_0117 |
|
|
0.0000000000002 |
0.000000021 |
0.00000045 |
lowN_TMEVA | 0.001190 | 1.73 |
| Thaps_hclust_0117 |
|
|
0.0000000000002 |
0.000000021 |
0.00000045 |
diel_exponential_vs_stationary | 0.001110 | -0.635 |
| Thaps_hclust_0117 |
|
|
0.0000000000002 |
0.000000021 |
0.00000045 |
lowSi_TMEVA | 0.248000 | -0.559 |
| Thaps_hclust_0117 |
|
|
0.0000000000002 |
0.000000021 |
0.00000045 |
highlight_arrays | 0.000442 | 1.78 |
| Thaps_hclust_0117 |
|
|
0.0000000000002 |
0.000000021 |
0.00000045 |
diel_light_vs_dark | 0.007840 | -0.519 |
| Thaps_hclust_0117 |
|
|
0.0000000000002 |
0.000000021 |
0.00000045 |
lowFe_KTKB_Day3 | 0.093700 | -0.399 |
| Thaps_hclust_0117 |
|
|
0.0000000000002 |
0.000000021 |
0.00000045 |
lowFe_KTKB_Day5 | 0.646000 | 0.101 |
| Thaps_hclust_0117 |
|
|
0.0000000000002 |
0.000000021 |
0.00000045 |
BaP | 0.002730 | -0.637 |
| Thaps_hclust_0117 |
|
|
0.0000000000002 |
0.000000021 |
0.00000045 |
exponential_vs_stationary_24highlight | 0.000526 | -1.24 |
| Thaps_hclust_0117 |
|
|
0.0000000000002 |
0.000000021 |
0.00000045 |
co2_elevated_stat_arrays | 0.000658 | 0.91 |
| Title | Cluster Plot | Dendrogram | e-value | e-value | e-value | Condition | Condition FDR | Condition Difference |
|---|---|---|---|---|---|---|---|---|
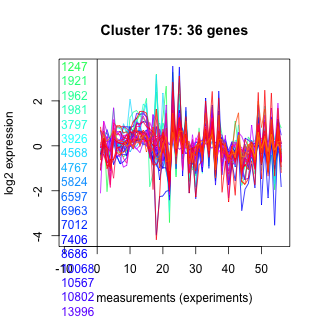
| Thaps_hclust_0175 |
 |
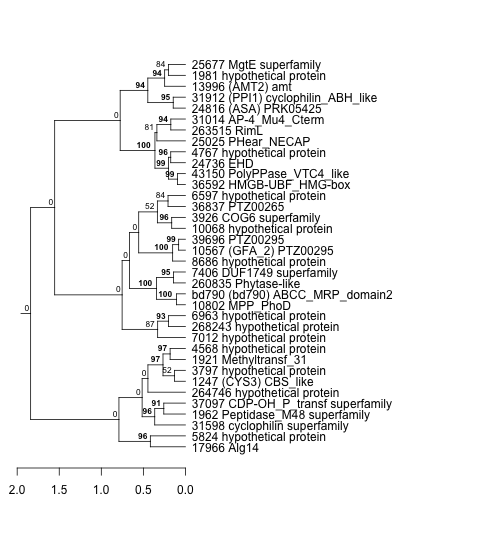 |
0.00000000000027 |
0.0000042 |
0.58 |
lowFe_KTKB_Day3 | 0.836000 | 0.0463 |
| Thaps_hclust_0175 |
|
|
0.00000000000027 |
0.0000042 |
0.58 |
lowFe_KTKB_Day5 | 0.858000 | -0.0313 |
| Thaps_hclust_0175 |
|
|
0.00000000000027 |
0.0000042 |
0.58 |
BaP | 0.859000 | 0.0358 |
| Thaps_hclust_0175 |
|
|
0.00000000000027 |
0.0000042 |
0.58 |
exponential_vs_stationary_24highlight | 0.000526 | 0.38 |
| Thaps_hclust_0175 |
|
|
0.00000000000027 |
0.0000042 |
0.58 |
co2_elevated_stat_arrays | 0.299000 | -0.212 |
| Thaps_hclust_0175 |
|
|
0.00000000000027 |
0.0000042 |
0.58 |
lowtemp_TMEVA | 0.042100 | 0.374 |
| Thaps_hclust_0175 |
|
|
0.00000000000027 |
0.0000042 |
0.58 |
highpH_TMEVA | 0.021700 | -0.282 |
| Thaps_hclust_0175 |
|
|
0.00000000000027 |
0.0000042 |
0.58 |
co2_elevated_expo_arrays | 0.268000 | 0.153 |
| Thaps_hclust_0175 |
|
|
0.00000000000027 |
0.0000042 |
0.58 |
lowFe_TMEVA | 0.285000 | 0.249 |
| Thaps_hclust_0175 |
|
|
0.00000000000027 |
0.0000042 |
0.58 |
exponential_vs_stationary_24light | 0.000581 | 1.18 |
| Thaps_hclust_0175 |
|
|
0.00000000000027 |
0.0000042 |
0.58 |
lowN_TMEVA | 0.564000 | -0.188 |
| Thaps_hclust_0175 |
|
|
0.00000000000027 |
0.0000042 |
0.58 |
diel_exponential_vs_stationary | 0.019100 | 0.285 |
| Thaps_hclust_0175 |
|
|
0.00000000000027 |
0.0000042 |
0.58 |
lowSi_TMEVA | 0.244000 | -0.459 |
| Thaps_hclust_0175 |
|
|
0.00000000000027 |
0.0000042 |
0.58 |
highlight_arrays | 0.000442 | -0.45 |
| Thaps_hclust_0175 |
|
|
0.00000000000027 |
0.0000042 |
0.58 |
diel_light_vs_dark | 0.000485 | 1.13 |
| Title | Cluster Plot | Dendrogram | e-value | e-value | e-value | Condition | Condition FDR | Condition Difference |
|---|---|---|---|---|---|---|---|---|
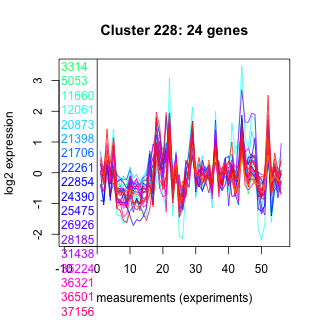
| Thaps_hclust_0228 |
 |
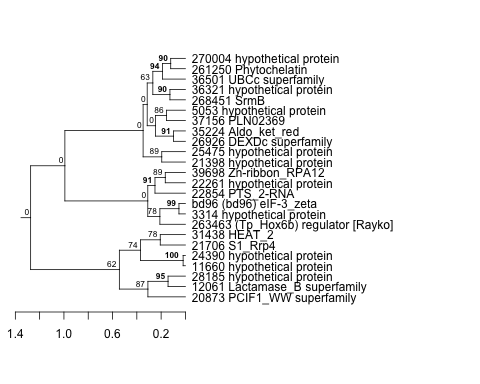 |
0.00000000000028 |
0.0027 |
0.016 |
lowFe_KTKB_Day3 | 0.975000 | 0.00784 |
| Thaps_hclust_0228 |
|
|
0.00000000000028 |
0.0027 |
0.016 |
lowFe_KTKB_Day5 | 0.314000 | -0.191 |
| Thaps_hclust_0228 |
|
|
0.00000000000028 |
0.0027 |
0.016 |
BaP | 0.013400 | 0.482 |
| Thaps_hclust_0228 |
|
|
0.00000000000028 |
0.0027 |
0.016 |
exponential_vs_stationary_24highlight | 0.231000 | -0.12 |
| Thaps_hclust_0228 |
|
|
0.00000000000028 |
0.0027 |
0.016 |
co2_elevated_stat_arrays | 0.000658 | 0.92 |
| Thaps_hclust_0228 |
|
|
0.00000000000028 |
0.0027 |
0.016 |
lowtemp_TMEVA | 0.059000 | 0.437 |
| Thaps_hclust_0228 |
|
|
0.00000000000028 |
0.0027 |
0.016 |
highpH_TMEVA | 0.753000 | -0.0574 |
| Thaps_hclust_0228 |
|
|
0.00000000000028 |
0.0027 |
0.016 |
co2_elevated_expo_arrays | 0.985000 | 0.011 |
| Thaps_hclust_0228 |
|
|
0.00000000000028 |
0.0027 |
0.016 |
lowFe_TMEVA | 0.177000 | -0.343 |
| Thaps_hclust_0228 |
|
|
0.00000000000028 |
0.0027 |
0.016 |
exponential_vs_stationary_24light | 0.074400 | -0.513 |
| Thaps_hclust_0228 |
|
|
0.00000000000028 |
0.0027 |
0.016 |
lowN_TMEVA | 0.182000 | 0.41 |
| Thaps_hclust_0228 |
|
|
0.00000000000028 |
0.0027 |
0.016 |
diel_exponential_vs_stationary | 0.765000 | -0.0633 |
| Thaps_hclust_0228 |
|
|
0.00000000000028 |
0.0027 |
0.016 |
lowSi_TMEVA | 0.921000 | -0.174 |
| Thaps_hclust_0228 |
|
|
0.00000000000028 |
0.0027 |
0.016 |
highlight_arrays | 0.000442 | 0.465 |
| Thaps_hclust_0228 |
|
|
0.00000000000028 |
0.0027 |
0.016 |
diel_light_vs_dark | 0.208000 | -0.242 |
| Title | Cluster Plot | Dendrogram | e-value | e-value | e-value | Condition | Condition FDR | Condition Difference |
|---|---|---|---|---|---|---|---|---|
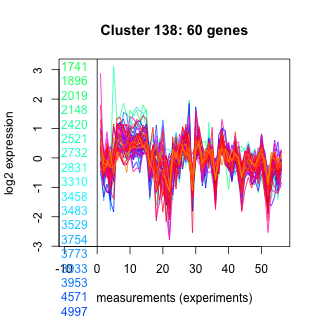
| Thaps_hclust_0138 |
 |
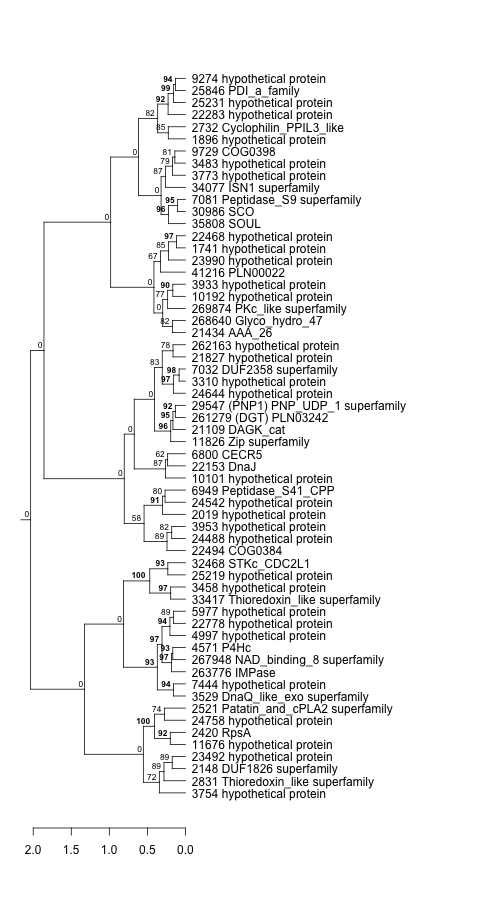 |
0.00000000000028 |
0.0000000011 |
0.0000065 |
lowFe_TMEVA | 0.003700 | -0.403 |
| Thaps_hclust_0138 |
|
|
0.00000000000028 |
0.0000000011 |
0.0000065 |
exponential_vs_stationary_24light | 0.891000 | -0.0446 |
| Thaps_hclust_0138 |
|
|
0.00000000000028 |
0.0000000011 |
0.0000065 |
lowN_TMEVA | 0.689000 | -0.138 |
| Thaps_hclust_0138 |
|
|
0.00000000000028 |
0.0000000011 |
0.0000065 |
diel_exponential_vs_stationary | 0.001600 | -0.29 |
| Thaps_hclust_0138 |
|
|
0.00000000000028 |
0.0000000011 |
0.0000065 |
lowSi_TMEVA | 0.081300 | -0.472 |
| Thaps_hclust_0138 |
|
|
0.00000000000028 |
0.0000000011 |
0.0000065 |
highlight_arrays | 0.162000 | 0.136 |
| Thaps_hclust_0138 |
|
|
0.00000000000028 |
0.0000000011 |
0.0000065 |
diel_light_vs_dark | 0.969000 | -0.00879 |
| Thaps_hclust_0138 |
|
|
0.00000000000028 |
0.0000000011 |
0.0000065 |
lowFe_KTKB_Day3 | 0.022700 | -0.275 |
| Thaps_hclust_0138 |
|
|
0.00000000000028 |
0.0000000011 |
0.0000065 |
lowFe_KTKB_Day5 | 0.957000 | -0.00822 |
| Thaps_hclust_0138 |
|
|
0.00000000000028 |
0.0000000011 |
0.0000065 |
BaP | 0.000370 | -0.443 |
| Thaps_hclust_0138 |
|
|
0.00000000000028 |
0.0000000011 |
0.0000065 |
exponential_vs_stationary_24highlight | 0.967000 | 0.00394 |
| Thaps_hclust_0138 |
|
|
0.00000000000028 |
0.0000000011 |
0.0000065 |
co2_elevated_stat_arrays | 0.000658 | -0.579 |
| Thaps_hclust_0138 |
|
|
0.00000000000028 |
0.0000000011 |
0.0000065 |
lowtemp_TMEVA | 0.599000 | -0.0875 |
| Thaps_hclust_0138 |
|
|
0.00000000000028 |
0.0000000011 |
0.0000065 |
highpH_TMEVA | 0.000725 | 0.306 |
| Thaps_hclust_0138 |
|
|
0.00000000000028 |
0.0000000011 |
0.0000065 |
co2_elevated_expo_arrays | 0.833000 | -0.0657 |
| Title | Cluster Plot | Dendrogram | e-value | e-value | e-value | Condition | Condition FDR | Condition Difference |
|---|---|---|---|---|---|---|---|---|
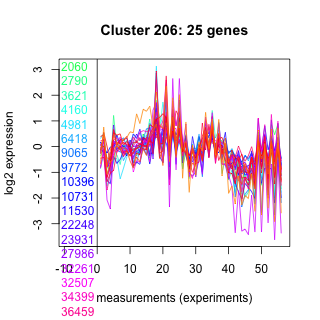
| Thaps_hclust_0206 |
 |
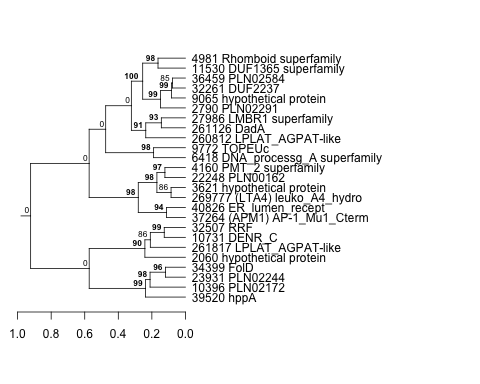 |
0.00000000000075 |
0.0000028 |
3.5 |
lowSi_TMEVA | 0.022400 | -0.766 |
| Thaps_hclust_0206 |
|
|
0.00000000000075 |
0.0000028 |
3.5 |
highlight_arrays | 0.000442 | -0.568 |
| Thaps_hclust_0206 |
|
|
0.00000000000075 |
0.0000028 |
3.5 |
diel_light_vs_dark | 0.000485 | 0.717 |
| Thaps_hclust_0206 |
|
|
0.00000000000075 |
0.0000028 |
3.5 |
lowFe_KTKB_Day3 | 0.172000 | 0.28 |
| Thaps_hclust_0206 |
|
|
0.00000000000075 |
0.0000028 |
3.5 |
lowFe_KTKB_Day5 | 0.090100 | 0.295 |
| Thaps_hclust_0206 |
|
|
0.00000000000075 |
0.0000028 |
3.5 |
BaP | 0.000370 | 0.811 |
| Thaps_hclust_0206 |
|
|
0.00000000000075 |
0.0000028 |
3.5 |
exponential_vs_stationary_24highlight | 0.000526 | 0.494 |
| Thaps_hclust_0206 |
|
|
0.00000000000075 |
0.0000028 |
3.5 |
co2_elevated_stat_arrays | 0.353000 | -0.207 |
| Thaps_hclust_0206 |
|
|
0.00000000000075 |
0.0000028 |
3.5 |
lowtemp_TMEVA | 0.909000 | 0.0348 |
| Thaps_hclust_0206 |
|
|
0.00000000000075 |
0.0000028 |
3.5 |
highpH_TMEVA | 0.242000 | -0.17 |
| Thaps_hclust_0206 |
|
|
0.00000000000075 |
0.0000028 |
3.5 |
co2_elevated_expo_arrays | 0.969000 | 0.0243 |
| Thaps_hclust_0206 |
|
|
0.00000000000075 |
0.0000028 |
3.5 |
lowFe_TMEVA | 0.853000 | 0.0703 |
| Thaps_hclust_0206 |
|
|
0.00000000000075 |
0.0000028 |
3.5 |
exponential_vs_stationary_24light | 0.000581 | 1.28 |
| Thaps_hclust_0206 |
|
|
0.00000000000075 |
0.0000028 |
3.5 |
lowN_TMEVA | 0.001190 | -0.92 |
| Thaps_hclust_0206 |
|
|
0.00000000000075 |
0.0000028 |
3.5 |
diel_exponential_vs_stationary | 0.002080 | 0.474 |
| Title | Cluster Plot | Dendrogram | e-value | e-value | e-value | Condition | Condition FDR | Condition Difference |
|---|---|---|---|---|---|---|---|---|
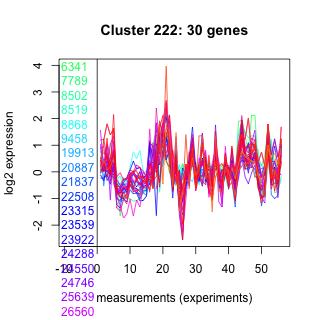
| Thaps_hclust_0222 |
 |
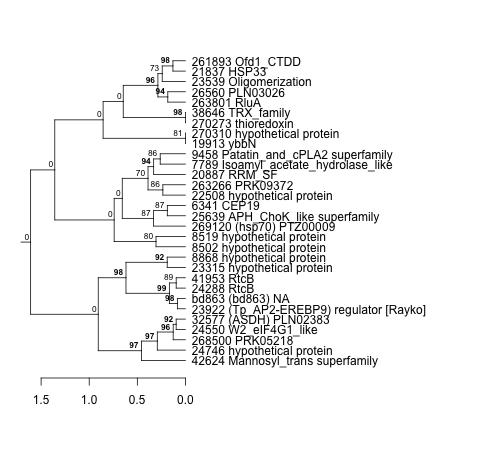 |
0.0000000000016 |
0.000000011 |
0.0008 |
diel_exponential_vs_stationary | 0.937000 | 0.017 |
| Thaps_hclust_0222 |
|
|
0.0000000000016 |
0.000000011 |
0.0008 |
lowSi_TMEVA | 0.839000 | 0.22 |
| Thaps_hclust_0222 |
|
|
0.0000000000016 |
0.000000011 |
0.0008 |
highlight_arrays | 0.007670 | 0.334 |
| Title | Cluster Plot | Dendrogram | e-value | e-value | e-value | Condition | Condition FDR | Condition Difference |
|---|---|---|---|---|---|---|---|---|
| Thaps_hclust_0256 |
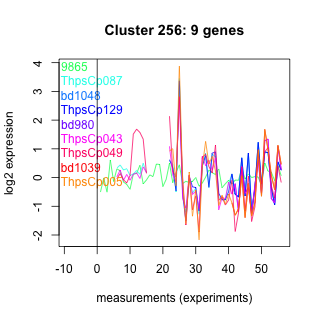 |
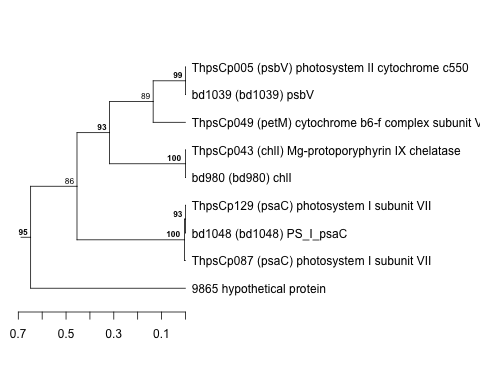 |
0.0000000000016 |
0.0000000000033 |
0.0000000000017 |
lowN_TMEVA | 0.261000 | -0.508 |
| Thaps_hclust_0256 |
|
|
0.0000000000016 |
0.0000000000033 |
0.0000000000017 |
diel_exponential_vs_stationary | 0.000602 | 1.25 |