Hierarchical Clusters
Displaying 1801 - 1900 of 7500
| Title | Cluster Plot | Dendrogram | e-value | e-value | e-value | Condition | Condition FDR | Condition Difference |
|---|---|---|---|---|---|---|---|---|
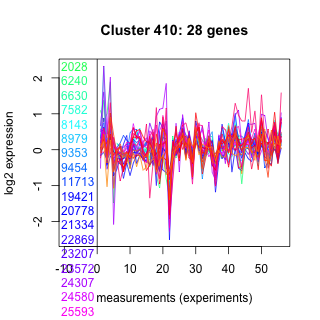
| Thaps_hclust_0410 |
 |
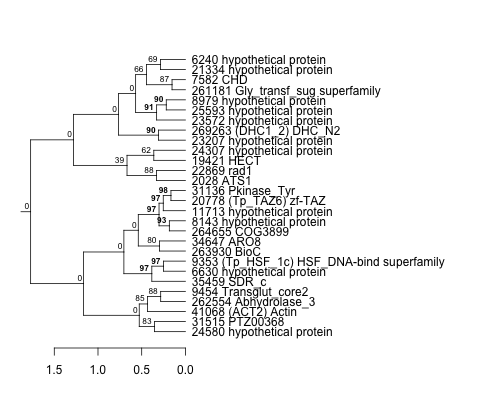 |
0.065 |
0.56 |
0.36 |
exponential_vs_stationary_24highlight | 0.224000 | -0.112 |
| Thaps_hclust_0410 |
|
|
0.065 |
0.56 |
0.36 |
co2_elevated_stat_arrays | 0.083600 | -0.327 |
| Thaps_hclust_0410 |
|
|
0.065 |
0.56 |
0.36 |
lowtemp_TMEVA | 0.091300 | -0.351 |
| Thaps_hclust_0410 |
|
|
0.065 |
0.56 |
0.36 |
highpH_TMEVA | 0.319000 | 0.141 |
| Thaps_hclust_0410 |
|
|
0.065 |
0.56 |
0.36 |
co2_elevated_expo_arrays | 1.000000 | 0.000102 |
| Thaps_hclust_0410 |
|
|
0.065 |
0.56 |
0.36 |
lowFe_TMEVA | 0.001040 | 0.656 |
| Thaps_hclust_0410 |
|
|
0.065 |
0.56 |
0.36 |
exponential_vs_stationary_24light | 0.294000 | -0.298 |
| Thaps_hclust_0410 |
|
|
0.065 |
0.56 |
0.36 |
lowN_TMEVA | 0.716000 | -0.131 |
| Thaps_hclust_0410 |
|
|
0.065 |
0.56 |
0.36 |
diel_exponential_vs_stationary | 0.094900 | -0.247 |
| Thaps_hclust_0410 |
|
|
0.065 |
0.56 |
0.36 |
lowSi_TMEVA | 0.050000 | 0.638 |
| Thaps_hclust_0410 |
|
|
0.065 |
0.56 |
0.36 |
highlight_arrays | 0.936000 | -0.0142 |
| Thaps_hclust_0410 |
|
|
0.065 |
0.56 |
0.36 |
diel_light_vs_dark | 0.816000 | 0.0562 |
| Thaps_hclust_0410 |
|
|
0.065 |
0.56 |
0.36 |
lowFe_KTKB_Day3 | 0.926000 | 0.0259 |
| Thaps_hclust_0410 |
|
|
0.065 |
0.56 |
0.36 |
lowFe_KTKB_Day5 | 0.820000 | 0.0457 |
| Thaps_hclust_0410 |
|
|
0.065 |
0.56 |
0.36 |
BaP | 0.949000 | 0.0159 |
| Title | Cluster Plot | Dendrogram | e-value | e-value | e-value | Condition | Condition FDR | Condition Difference |
|---|---|---|---|---|---|---|---|---|
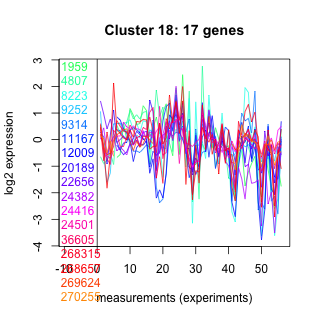
| Thaps_hclust_0018 |
 |
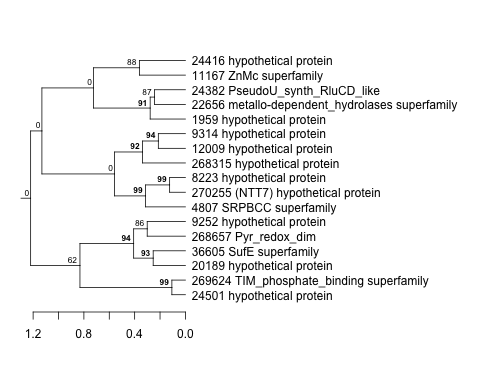 |
0.065 |
0.38 |
0.16 |
highlight_arrays | 0.000442 | 0.572 |
| Thaps_hclust_0018 |
|
|
0.065 |
0.38 |
0.16 |
diel_light_vs_dark | 0.000926 | -0.665 |
| Thaps_hclust_0018 |
|
|
0.065 |
0.38 |
0.16 |
lowFe_KTKB_Day3 | 0.968000 | -0.0158 |
| Thaps_hclust_0018 |
|
|
0.065 |
0.38 |
0.16 |
lowFe_KTKB_Day5 | 0.208000 | 0.274 |
| Thaps_hclust_0018 |
|
|
0.065 |
0.38 |
0.16 |
BaP | 0.284000 | -0.259 |
| Thaps_hclust_0018 |
|
|
0.065 |
0.38 |
0.16 |
exponential_vs_stationary_24highlight | 0.395000 | -0.103 |
| Thaps_hclust_0018 |
|
|
0.065 |
0.38 |
0.16 |
co2_elevated_stat_arrays | 0.000658 | 1.14 |
| Thaps_hclust_0018 |
|
|
0.065 |
0.38 |
0.16 |
lowtemp_TMEVA | 0.458000 | 0.207 |
| Thaps_hclust_0018 |
|
|
0.065 |
0.38 |
0.16 |
highpH_TMEVA | 0.018500 | 0.42 |
| Thaps_hclust_0018 |
|
|
0.065 |
0.38 |
0.16 |
co2_elevated_expo_arrays | 0.230000 | 0.204 |
| Thaps_hclust_0018 |
|
|
0.065 |
0.38 |
0.16 |
lowFe_TMEVA | 0.508000 | -0.205 |
| Thaps_hclust_0018 |
|
|
0.065 |
0.38 |
0.16 |
exponential_vs_stationary_24light | 0.604000 | 0.202 |
| Thaps_hclust_0018 |
|
|
0.065 |
0.38 |
0.16 |
lowN_TMEVA | 0.051700 | -0.671 |
| Thaps_hclust_0018 |
|
|
0.065 |
0.38 |
0.16 |
diel_exponential_vs_stationary | 0.000602 | 0.915 |
| Thaps_hclust_0018 |
|
|
0.065 |
0.38 |
0.16 |
lowSi_TMEVA | 0.557000 | -0.386 |
| Title | Cluster Plot | Dendrogram | e-value | e-value | e-value | Condition | Condition FDR | Condition Difference |
|---|---|---|---|---|---|---|---|---|
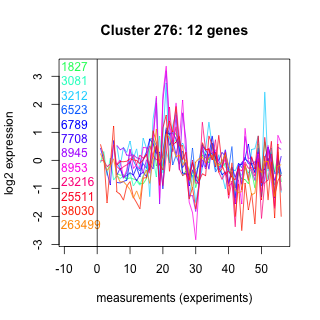
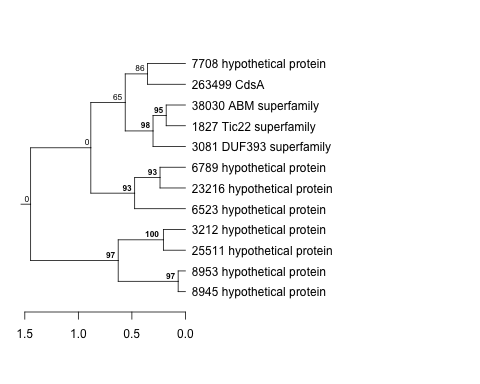
| Thaps_hclust_0276 |
 |
 |
0.063 |
39 |
53 |
exponential_vs_stationary_24light | 0.044000 | 0.777 |
| Thaps_hclust_0276 |
|
|
0.063 |
39 |
53 |
lowN_TMEVA | 0.128000 | -0.616 |
| Thaps_hclust_0276 |
|
|
0.063 |
39 |
53 |
diel_exponential_vs_stationary | 0.000602 | 0.877 |
| Thaps_hclust_0276 |
|
|
0.063 |
39 |
53 |
lowSi_TMEVA | 0.806000 | -0.263 |
| Thaps_hclust_0276 |
|
|
0.063 |
39 |
53 |
highlight_arrays | 0.280000 | -0.221 |
| Thaps_hclust_0276 |
|
|
0.063 |
39 |
53 |
diel_light_vs_dark | 0.972000 | 0.0128 |
| Thaps_hclust_0276 |
|
|
0.063 |
39 |
53 |
lowFe_KTKB_Day3 | 0.799000 | -0.0908 |
| Thaps_hclust_0276 |
|
|
0.063 |
39 |
53 |
lowFe_KTKB_Day5 | 0.045800 | 0.538 |
| Thaps_hclust_0276 |
|
|
0.063 |
39 |
53 |
BaP | 0.042100 | 0.562 |
| Thaps_hclust_0276 |
|
|
0.063 |
39 |
53 |
exponential_vs_stationary_24highlight | 0.000526 | 0.486 |
| Thaps_hclust_0276 |
|
|
0.063 |
39 |
53 |
co2_elevated_stat_arrays | 0.126000 | 0.408 |
| Thaps_hclust_0276 |
|
|
0.063 |
39 |
53 |
lowtemp_TMEVA | 0.265000 | 0.366 |
| Thaps_hclust_0276 |
|
|
0.063 |
39 |
53 |
highpH_TMEVA | 0.253000 | 0.231 |
| Thaps_hclust_0276 |
|
|
0.063 |
39 |
53 |
co2_elevated_expo_arrays | 0.802000 | -0.0902 |
| Thaps_hclust_0276 |
|
|
0.063 |
39 |
53 |
lowFe_TMEVA | 0.853000 | 0.0864 |
| Title | Cluster Plot | Dendrogram | e-value | e-value | e-value | Condition | Condition FDR | Condition Difference |
|---|---|---|---|---|---|---|---|---|
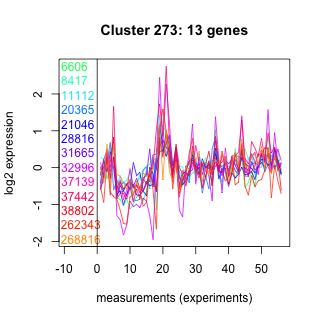
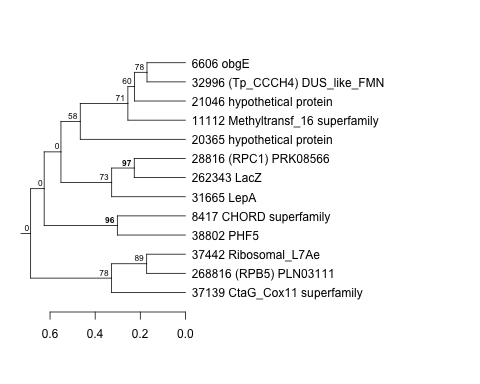
| Thaps_hclust_0273 |
 |
 |
0.052 |
0.27 |
12 |
highpH_TMEVA | 0.205000 | -0.245 |
| Thaps_hclust_0273 |
|
|
0.052 |
0.27 |
12 |
co2_elevated_expo_arrays | 0.827000 | 0.0848 |
| Thaps_hclust_0273 |
|
|
0.052 |
0.27 |
12 |
lowFe_TMEVA | 0.795000 | -0.112 |
| Thaps_hclust_0273 |
|
|
0.052 |
0.27 |
12 |
exponential_vs_stationary_24light | 0.713000 | -0.17 |
| Thaps_hclust_0273 |
|
|
0.052 |
0.27 |
12 |
lowN_TMEVA | 0.523000 | 0.255 |
| Thaps_hclust_0273 |
|
|
0.052 |
0.27 |
12 |
diel_exponential_vs_stationary | 0.976000 | 0.01 |
| Thaps_hclust_0273 |
|
|
0.052 |
0.27 |
12 |
lowSi_TMEVA | 1.000000 | -0.0629 |
| Thaps_hclust_0273 |
|
|
0.052 |
0.27 |
12 |
highlight_arrays | 0.745000 | -0.0741 |
| Thaps_hclust_0273 |
|
|
0.052 |
0.27 |
12 |
diel_light_vs_dark | 0.779000 | -0.0974 |
| Thaps_hclust_0273 |
|
|
0.052 |
0.27 |
12 |
lowFe_KTKB_Day3 | 0.453000 | -0.234 |
| Thaps_hclust_0273 |
|
|
0.052 |
0.27 |
12 |
lowFe_KTKB_Day5 | 0.354000 | -0.234 |
| Thaps_hclust_0273 |
|
|
0.052 |
0.27 |
12 |
BaP | 0.013800 | 0.658 |
| Thaps_hclust_0273 |
|
|
0.052 |
0.27 |
12 |
exponential_vs_stationary_24highlight | 0.554000 | -0.0855 |
| Thaps_hclust_0273 |
|
|
0.052 |
0.27 |
12 |
co2_elevated_stat_arrays | 0.823000 | 0.0679 |
| Thaps_hclust_0273 |
|
|
0.052 |
0.27 |
12 |
lowtemp_TMEVA | 0.225000 | 0.379 |
| Title | Cluster Plot | Dendrogram | e-value | e-value | e-value | Condition | Condition FDR | Condition Difference |
|---|---|---|---|---|---|---|---|---|
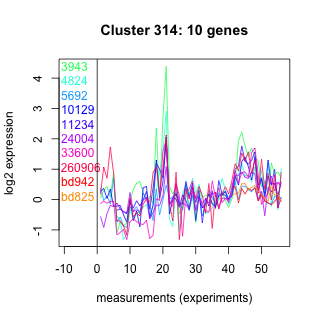
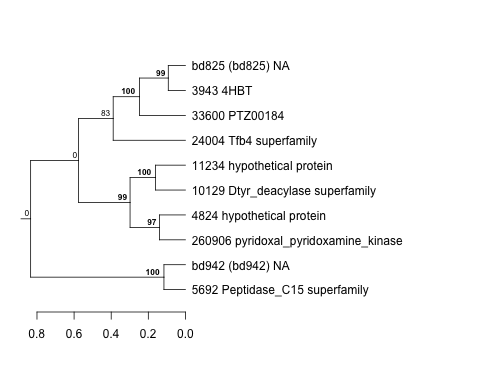
| Thaps_hclust_0314 |
 |
 |
0.052 |
1.9 |
8.5 |
diel_exponential_vs_stationary | 0.389000 | -0.225 |
| Thaps_hclust_0314 |
|
|
0.052 |
1.9 |
8.5 |
lowSi_TMEVA | 0.758000 | 0.292 |
| Thaps_hclust_0314 |
|
|
0.052 |
1.9 |
8.5 |
highlight_arrays | 0.031900 | 0.463 |
| Thaps_hclust_0314 |
|
|
0.052 |
1.9 |
8.5 |
diel_light_vs_dark | 0.825000 | 0.0877 |
| Thaps_hclust_0314 |
|
|
0.052 |
1.9 |
8.5 |
lowFe_KTKB_Day3 | 0.177000 | -0.446 |
| Thaps_hclust_0314 |
|
|
0.052 |
1.9 |
8.5 |
lowFe_KTKB_Day5 | 0.517000 | -0.191 |
| Thaps_hclust_0314 |
|
|
0.052 |
1.9 |
8.5 |
BaP | 0.001320 | 1.03 |
| Thaps_hclust_0314 |
|
|
0.052 |
1.9 |
8.5 |
exponential_vs_stationary_24highlight | 0.101000 | -0.245 |
| Thaps_hclust_0314 |
|
|
0.052 |
1.9 |
8.5 |
co2_elevated_stat_arrays | 0.671000 | 0.133 |
| Thaps_hclust_0314 |
|
|
0.052 |
1.9 |
8.5 |
lowtemp_TMEVA | 0.371000 | 0.321 |
| Thaps_hclust_0314 |
|
|
0.052 |
1.9 |
8.5 |
highpH_TMEVA | 0.929000 | 0.0323 |
| Thaps_hclust_0314 |
|
|
0.052 |
1.9 |
8.5 |
co2_elevated_expo_arrays | 0.969000 | -0.0277 |
| Thaps_hclust_0314 |
|
|
0.052 |
1.9 |
8.5 |
lowFe_TMEVA | 0.788000 | 0.123 |
| Thaps_hclust_0314 |
|
|
0.052 |
1.9 |
8.5 |
exponential_vs_stationary_24light | 0.614000 | -0.235 |
| Thaps_hclust_0314 |
|
|
0.052 |
1.9 |
8.5 |
lowN_TMEVA | 0.789000 | 0.115 |
| Title | Cluster Plot | Dendrogram | e-value | e-value | e-value | Condition | Condition FDR | Condition Difference |
|---|---|---|---|---|---|---|---|---|
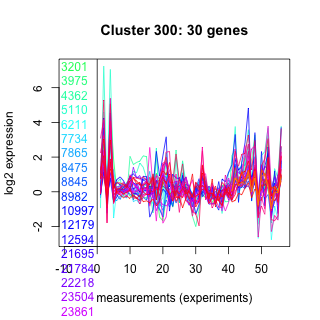
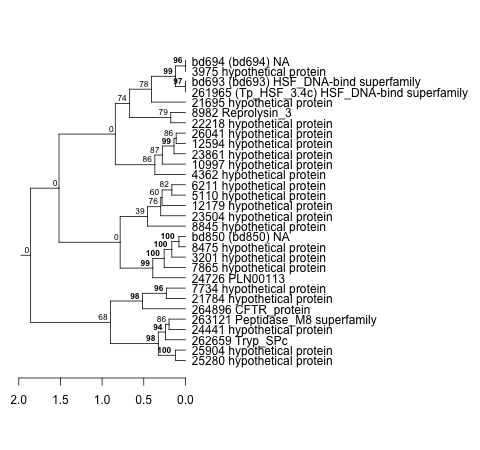
| Thaps_hclust_0300 |
 |
 |
0.05 |
11 |
3.8 |
diel_light_vs_dark | 0.662000 | -0.0947 |
| Thaps_hclust_0300 |
|
|
0.05 |
11 |
3.8 |
lowFe_KTKB_Day3 | 0.777000 | 0.0694 |
| Thaps_hclust_0300 |
|
|
0.05 |
11 |
3.8 |
lowFe_KTKB_Day5 | 0.509000 | 0.117 |
| Thaps_hclust_0300 |
|
|
0.05 |
11 |
3.8 |
BaP | 0.073200 | 0.306 |
| Thaps_hclust_0300 |
|
|
0.05 |
11 |
3.8 |
exponential_vs_stationary_24highlight | 0.000526 | -0.713 |
| Thaps_hclust_0300 |
|
|
0.05 |
11 |
3.8 |
co2_elevated_stat_arrays | 0.009210 | 0.449 |
| Thaps_hclust_0300 |
|
|
0.05 |
11 |
3.8 |
lowtemp_TMEVA | 0.929000 | -0.0252 |
| Thaps_hclust_0300 |
|
|
0.05 |
11 |
3.8 |
highpH_TMEVA | 0.000725 | 0.52 |
| Thaps_hclust_0300 |
|
|
0.05 |
11 |
3.8 |
co2_elevated_expo_arrays | 0.001390 | 0.384 |
| Thaps_hclust_0300 |
|
|
0.05 |
11 |
3.8 |
lowFe_TMEVA | 0.001040 | 2.61 |
| Thaps_hclust_0300 |
|
|
0.05 |
11 |
3.8 |
exponential_vs_stationary_24light | 0.000581 | -1.26 |
| Thaps_hclust_0300 |
|
|
0.05 |
11 |
3.8 |
lowN_TMEVA | 0.136000 | -0.409 |
| Thaps_hclust_0300 |
|
|
0.05 |
11 |
3.8 |
diel_exponential_vs_stationary | 0.096400 | 0.238 |
| Thaps_hclust_0300 |
|
|
0.05 |
11 |
3.8 |
lowSi_TMEVA | 0.001350 | 2.9 |
| Thaps_hclust_0300 |
|
|
0.05 |
11 |
3.8 |
highlight_arrays | 0.000442 | 0.548 |
| Title | Cluster Plot | Dendrogram | e-value | e-value | e-value | Condition | Condition FDR | Condition Difference |
|---|---|---|---|---|---|---|---|---|
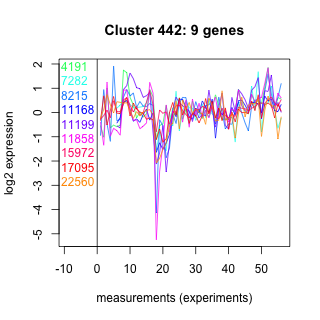
| Thaps_hclust_0442 |
 |
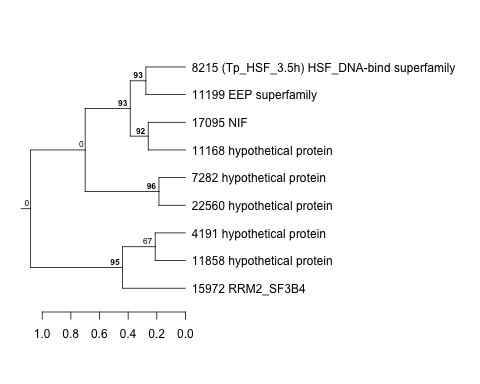 |
0.045 |
2.3 |
2.8 |
lowFe_KTKB_Day3 | 0.140000 | 0.528 |
| Thaps_hclust_0442 |
|
|
0.045 |
2.3 |
2.8 |
lowFe_KTKB_Day5 | 0.787000 | 0.0878 |
| Thaps_hclust_0442 |
|
|
0.045 |
2.3 |
2.8 |
BaP | 0.000370 | -1.3 |
| Thaps_hclust_0442 |
|
|
0.045 |
2.3 |
2.8 |
exponential_vs_stationary_24highlight | 0.240000 | 0.187 |
| Thaps_hclust_0442 |
|
|
0.045 |
2.3 |
2.8 |
co2_elevated_stat_arrays | 0.051300 | 0.573 |
| Thaps_hclust_0442 |
|
|
0.045 |
2.3 |
2.8 |
lowtemp_TMEVA | 0.388000 | 0.311 |
| Thaps_hclust_0442 |
|
|
0.045 |
2.3 |
2.8 |
highpH_TMEVA | 0.052400 | -0.453 |
| Thaps_hclust_0442 |
|
|
0.045 |
2.3 |
2.8 |
co2_elevated_expo_arrays | 0.802000 | 0.099 |
| Thaps_hclust_0442 |
|
|
0.045 |
2.3 |
2.8 |
lowFe_TMEVA | 0.795000 | -0.122 |
| Thaps_hclust_0442 |
|
|
0.045 |
2.3 |
2.8 |
exponential_vs_stationary_24light | 0.684000 | 0.209 |