Hierarchical Clusters
Displaying 101 - 200 of 7500
| Title | Cluster Plot | Dendrogram | e-value | e-value | e-value | Condition | Condition FDR | Condition Difference |
|---|---|---|---|---|---|---|---|---|
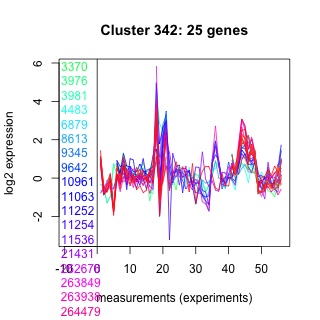
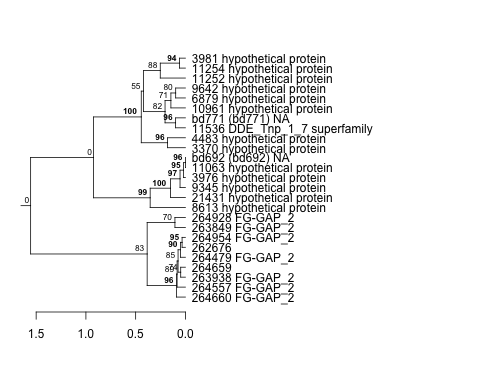
| Thaps_hclust_0342 |
 |
 |
5.79997e-41 |
2.7e-33 |
3.1e-31 |
exponential_vs_stationary_24light | 0.457000 | -0.234 |
| Thaps_hclust_0342 |
|
|
5.79997e-41 |
2.7e-33 |
3.1e-31 |
lowN_TMEVA | 0.026800 | -0.609 |
| Thaps_hclust_0342 |
|
|
5.79997e-41 |
2.7e-33 |
3.1e-31 |
diel_exponential_vs_stationary | 0.639000 | 0.0897 |
| Thaps_hclust_0342 |
|
|
5.79997e-41 |
2.7e-33 |
3.1e-31 |
lowSi_TMEVA | 0.832000 | -0.226 |
| Thaps_hclust_0342 |
|
|
5.79997e-41 |
2.7e-33 |
3.1e-31 |
highlight_arrays | 0.000442 | 1.21 |
| Title | Cluster Plot | Dendrogram | e-value | e-value | e-value | Condition | Condition FDR | Condition Difference |
|---|---|---|---|---|---|---|---|---|
| Thaps_hclust_0065 |
 |
 |
1.5e-32 |
2.5e-32 |
9.9e-33 |
lowFe_KTKB_Day5 | 0.001320 | -0.51 |
| Thaps_hclust_0065 |
|
|
1.5e-32 |
2.5e-32 |
9.9e-33 |
BaP | 0.025500 | -0.349 |
| Thaps_hclust_0065 |
|
|
1.5e-32 |
2.5e-32 |
9.9e-33 |
exponential_vs_stationary_24highlight | 0.000526 | 0.32 |
| Thaps_hclust_0065 |
|
|
1.5e-32 |
2.5e-32 |
9.9e-33 |
co2_elevated_stat_arrays | 0.001190 | 0.507 |
| Thaps_hclust_0065 |
|
|
1.5e-32 |
2.5e-32 |
9.9e-33 |
lowtemp_TMEVA | 0.734000 | 0.0731 |
| Thaps_hclust_0065 |
|
|
1.5e-32 |
2.5e-32 |
9.9e-33 |
highpH_TMEVA | 0.000725 | -0.512 |
| Thaps_hclust_0065 |
|
|
1.5e-32 |
2.5e-32 |
9.9e-33 |
co2_elevated_expo_arrays | 0.001390 | 0.337 |
| Thaps_hclust_0065 |
|
|
1.5e-32 |
2.5e-32 |
9.9e-33 |
lowFe_TMEVA | 0.002940 | -0.531 |
| Thaps_hclust_0065 |
|
|
1.5e-32 |
2.5e-32 |
9.9e-33 |
exponential_vs_stationary_24light | 0.000581 | 1.26 |
| Thaps_hclust_0065 |
|
|
1.5e-32 |
2.5e-32 |
9.9e-33 |
lowN_TMEVA | 0.122000 | -0.395 |
| Thaps_hclust_0065 |
|
|
1.5e-32 |
2.5e-32 |
9.9e-33 |
diel_exponential_vs_stationary | 0.000602 | 1.34 |
| Thaps_hclust_0065 |
|
|
1.5e-32 |
2.5e-32 |
9.9e-33 |
lowSi_TMEVA | 0.557000 | -0.33 |
| Thaps_hclust_0065 |
|
|
1.5e-32 |
2.5e-32 |
9.9e-33 |
highlight_arrays | 0.000442 | -1.63 |
| Thaps_hclust_0065 |
|
|
1.5e-32 |
2.5e-32 |
9.9e-33 |
diel_light_vs_dark | 0.000485 | -1.1 |
| Thaps_hclust_0065 |
|
|
1.5e-32 |
2.5e-32 |
9.9e-33 |
lowFe_KTKB_Day3 | 0.542000 | 0.122 |
| Title | Cluster Plot | Dendrogram | e-value | e-value | e-value | Condition | Condition FDR | Condition Difference |
|---|---|---|---|---|---|---|---|---|
| Thaps_hclust_0230 |
 |
|
|
1.1e-30 |
0.0000000000029 |
lowFe_KTKB_Day3 | 0.200000 | 0.124 |
| Thaps_hclust_0230 |
|
|
|
1.1e-30 |
0.0000000000029 |
lowFe_KTKB_Day5 | 0.964000 | 0.00449 |
| Thaps_hclust_0230 |
|
|
|
1.1e-30 |
0.0000000000029 |
BaP | 0.000370 | 0.702 |
| Thaps_hclust_0230 |
|
|
|
1.1e-30 |
0.0000000000029 |
exponential_vs_stationary_24highlight | 0.000526 | -0.223 |
| Thaps_hclust_0230 |
|
|
|
1.1e-30 |
0.0000000000029 |
co2_elevated_stat_arrays | 0.000658 | 0.639 |
| Thaps_hclust_0230 |
|
|
|
1.1e-30 |
0.0000000000029 |
lowtemp_TMEVA | 0.000735 | 0.532 |
| Thaps_hclust_0230 |
|
|
|
1.1e-30 |
0.0000000000029 |
highpH_TMEVA | 0.000725 | -0.249 |
| Thaps_hclust_0230 |
|
|
|
1.1e-30 |
0.0000000000029 |
co2_elevated_expo_arrays | 0.934000 | -0.0495 |
| Thaps_hclust_0230 |
|
|
|
1.1e-30 |
0.0000000000029 |
lowFe_TMEVA | 0.943000 | 0.0434 |
| Thaps_hclust_0230 |
|
|
|
1.1e-30 |
0.0000000000029 |
exponential_vs_stationary_24light | 0.000581 | -0.701 |
| Thaps_hclust_0230 |
|
|
|
1.1e-30 |
0.0000000000029 |
lowN_TMEVA | 0.001190 | 0.459 |
| Thaps_hclust_0230 |
|
|
|
1.1e-30 |
0.0000000000029 |
diel_exponential_vs_stationary | 0.006360 | -0.192 |
| Thaps_hclust_0230 |
|
|
|
1.1e-30 |
0.0000000000029 |
lowSi_TMEVA | 0.402000 | 0.31 |
| Thaps_hclust_0230 |
|
|
|
1.1e-30 |
0.0000000000029 |
highlight_arrays | 0.656000 | 0.0409 |
| Thaps_hclust_0230 |
|
|
|
1.1e-30 |
0.0000000000029 |
diel_light_vs_dark | 0.000485 | -0.306 |
| Title | Cluster Plot | Dendrogram | e-value | e-value | e-value | Condition | Condition FDR | Condition Difference |
|---|---|---|---|---|---|---|---|---|
| Thaps_hclust_0082 |
 |
|
8.89825e-43 |
2e-27 |
1.3e-16 |
diel_light_vs_dark | 0.000485 | 1.67 |
| Thaps_hclust_0082 |
|
|
8.89825e-43 |
2e-27 |
1.3e-16 |
lowFe_KTKB_Day3 | 0.000862 | 0.987 |
| Thaps_hclust_0082 |
|
|
8.89825e-43 |
2e-27 |
1.3e-16 |
lowFe_KTKB_Day5 | 0.001320 | 0.728 |
| Thaps_hclust_0082 |
|
|
8.89825e-43 |
2e-27 |
1.3e-16 |
BaP | 0.824000 | -0.0268 |
| Thaps_hclust_0082 |
|
|
8.89825e-43 |
2e-27 |
1.3e-16 |
exponential_vs_stationary_24highlight | 0.000526 | 0.226 |
| Thaps_hclust_0082 |
|
|
8.89825e-43 |
2e-27 |
1.3e-16 |
co2_elevated_stat_arrays | 0.046800 | 0.253 |
| Thaps_hclust_0082 |
|
|
8.89825e-43 |
2e-27 |
1.3e-16 |
lowtemp_TMEVA | 1.000000 | -0.000692 |
| Thaps_hclust_0082 |
|
|
8.89825e-43 |
2e-27 |
1.3e-16 |
highpH_TMEVA | 0.000725 | -0.879 |
| Thaps_hclust_0082 |
|
|
8.89825e-43 |
2e-27 |
1.3e-16 |
co2_elevated_expo_arrays | 0.001390 | 1.09 |
| Thaps_hclust_0082 |
|
|
8.89825e-43 |
2e-27 |
1.3e-16 |
lowFe_TMEVA | 0.452000 | 0.152 |
| Thaps_hclust_0082 |
|
|
8.89825e-43 |
2e-27 |
1.3e-16 |
exponential_vs_stationary_24light | 0.000581 | 2.11 |
| Thaps_hclust_0082 |
|
|
8.89825e-43 |
2e-27 |
1.3e-16 |
lowN_TMEVA | 0.001190 | -0.512 |
| Thaps_hclust_0082 |
|
|
8.89825e-43 |
2e-27 |
1.3e-16 |
diel_exponential_vs_stationary | 0.170000 | 0.116 |
| Thaps_hclust_0082 |
|
|
8.89825e-43 |
2e-27 |
1.3e-16 |
lowSi_TMEVA | 0.001350 | -1.03 |
| Thaps_hclust_0082 |
|
|
8.89825e-43 |
2e-27 |
1.3e-16 |
highlight_arrays | 0.000442 | -0.807 |
| Title | Cluster Plot | Dendrogram | e-value | e-value | e-value | Condition | Condition FDR | Condition Difference |
|---|---|---|---|---|---|---|---|---|
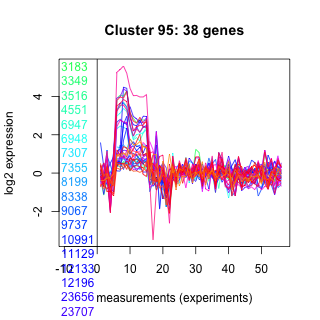
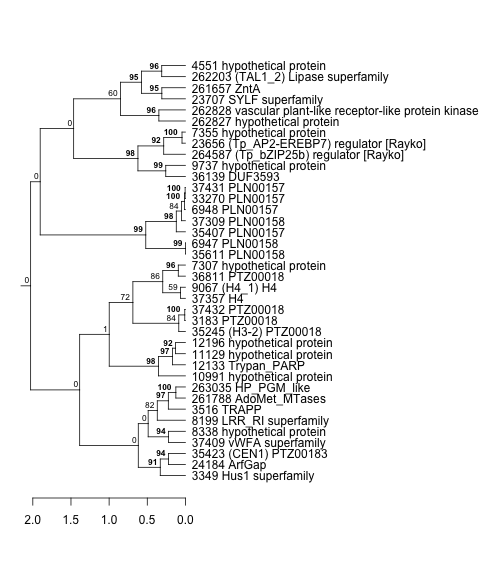
| Thaps_hclust_0095 |
 |
 |
5.3e-28 |
1.7e-25 |
1.6e-17 |
lowSi_TMEVA | 0.007000 | -0.745 |
| Thaps_hclust_0095 |
|
|
5.3e-28 |
1.7e-25 |
1.6e-17 |
highlight_arrays | 0.389000 | -0.109 |
| Thaps_hclust_0095 |
|
|
5.3e-28 |
1.7e-25 |
1.6e-17 |
diel_light_vs_dark | 0.144000 | 0.223 |
| Thaps_hclust_0095 |
|
|
5.3e-28 |
1.7e-25 |
1.6e-17 |
lowFe_KTKB_Day3 | 0.157000 | 0.238 |
| Thaps_hclust_0095 |
|
|
5.3e-28 |
1.7e-25 |
1.6e-17 |
lowFe_KTKB_Day5 | 0.865000 | -0.0291 |
| Thaps_hclust_0095 |
|
|
5.3e-28 |
1.7e-25 |
1.6e-17 |
BaP | 0.183000 | -0.209 |
| Thaps_hclust_0095 |
|
|
5.3e-28 |
1.7e-25 |
1.6e-17 |
exponential_vs_stationary_24highlight | 0.263000 | 0.0886 |
| Thaps_hclust_0095 |
|
|
5.3e-28 |
1.7e-25 |
1.6e-17 |
co2_elevated_stat_arrays | 0.999000 | -0.000503 |
| Thaps_hclust_0095 |
|
|
5.3e-28 |
1.7e-25 |
1.6e-17 |
lowtemp_TMEVA | 0.599000 | 0.106 |
| Thaps_hclust_0095 |
|
|
5.3e-28 |
1.7e-25 |
1.6e-17 |
highpH_TMEVA | 0.722000 | -0.0542 |
| Thaps_hclust_0095 |
|
|
5.3e-28 |
1.7e-25 |
1.6e-17 |
co2_elevated_expo_arrays | 0.629000 | 0.101 |
| Thaps_hclust_0095 |
|
|
5.3e-28 |
1.7e-25 |
1.6e-17 |
lowFe_TMEVA | 0.356000 | -0.218 |
| Thaps_hclust_0095 |
|
|
5.3e-28 |
1.7e-25 |
1.6e-17 |
exponential_vs_stationary_24light | 0.650000 | 0.137 |
| Thaps_hclust_0095 |
|
|
5.3e-28 |
1.7e-25 |
1.6e-17 |
lowN_TMEVA | 0.894000 | 0.0437 |
| Thaps_hclust_0095 |
|
|
5.3e-28 |
1.7e-25 |
1.6e-17 |
diel_exponential_vs_stationary | 0.096000 | -0.207 |
| Title | Cluster Plot | Dendrogram | e-value | e-value | e-value | Condition | Condition FDR | Condition Difference |
|---|---|---|---|---|---|---|---|---|
| Thaps_hclust_0069 |
 |
 |
1.2e-26 |
2.6e-24 |
2.4e-20 |
exponential_vs_stationary_24highlight | 0.000526 | 0.306 |
| Thaps_hclust_0069 |
|
|
1.2e-26 |
2.6e-24 |
2.4e-20 |
co2_elevated_stat_arrays | 0.000658 | 0.711 |
| Thaps_hclust_0069 |
|
|
1.2e-26 |
2.6e-24 |
2.4e-20 |
lowtemp_TMEVA | 0.041200 | -0.347 |
| Thaps_hclust_0069 |
|
|
1.2e-26 |
2.6e-24 |
2.4e-20 |
highpH_TMEVA | 0.000725 | -0.819 |
| Thaps_hclust_0069 |
|
|
1.2e-26 |
2.6e-24 |
2.4e-20 |
co2_elevated_expo_arrays | 0.660000 | 0.0935 |
| Thaps_hclust_0069 |
|
|
1.2e-26 |
2.6e-24 |
2.4e-20 |
lowFe_TMEVA | 0.001040 | -0.729 |
| Thaps_hclust_0069 |
|
|
1.2e-26 |
2.6e-24 |
2.4e-20 |
exponential_vs_stationary_24light | 0.000581 | 2.1 |
| Thaps_hclust_0069 |
|
|
1.2e-26 |
2.6e-24 |
2.4e-20 |
lowN_TMEVA | 0.004000 | -0.621 |
| Thaps_hclust_0069 |
|
|
1.2e-26 |
2.6e-24 |
2.4e-20 |
diel_exponential_vs_stationary | 0.000602 | 1.82 |
| Thaps_hclust_0069 |
|
|
1.2e-26 |
2.6e-24 |
2.4e-20 |
lowSi_TMEVA | 0.296000 | -0.408 |
| Thaps_hclust_0069 |
|
|
1.2e-26 |
2.6e-24 |
2.4e-20 |
highlight_arrays | 0.000442 | -1.38 |
| Thaps_hclust_0069 |
|
|
1.2e-26 |
2.6e-24 |
2.4e-20 |
diel_light_vs_dark | 0.004510 | -0.384 |
| Thaps_hclust_0069 |
|
|
1.2e-26 |
2.6e-24 |
2.4e-20 |
lowFe_KTKB_Day3 | 0.463000 | -0.129 |
| Thaps_hclust_0069 |
|
|
1.2e-26 |
2.6e-24 |
2.4e-20 |
lowFe_KTKB_Day5 | 0.059800 | -0.251 |
| Thaps_hclust_0069 |
|
|
1.2e-26 |
2.6e-24 |
2.4e-20 |
BaP | 0.492000 | -0.111 |
| Title | Cluster Plot | Dendrogram | e-value | e-value | e-value | Condition | Condition FDR | Condition Difference |
|---|---|---|---|---|---|---|---|---|
| Thaps_hclust_0022 |
 |
|
1.9e-31 |
2.4e-22 |
6.4e-20 |
lowFe_TMEVA | 0.001040 | -2.14 |
| Thaps_hclust_0022 |
|
|
1.9e-31 |
2.4e-22 |
6.4e-20 |
exponential_vs_stationary_24light | 0.000581 | 3.47 |
| Thaps_hclust_0022 |
|
|
1.9e-31 |
2.4e-22 |
6.4e-20 |
lowN_TMEVA | 0.001190 | -4.56 |
| Thaps_hclust_0022 |
|
|
1.9e-31 |
2.4e-22 |
6.4e-20 |
diel_exponential_vs_stationary | 0.000602 | 3.06 |
| Thaps_hclust_0022 |
|
|
1.9e-31 |
2.4e-22 |
6.4e-20 |
diel_light_vs_dark | 0.000485 | -0.451 |
| Thaps_hclust_0022 |
|
|
1.9e-31 |
2.4e-22 |
6.4e-20 |
lowSi_TMEVA | 0.001350 | -4.7 |
| Thaps_hclust_0022 |
|
|
1.9e-31 |
2.4e-22 |
6.4e-20 |
lowFe_KTKB_Day3 | 0.049500 | 0.245 |
| Thaps_hclust_0022 |
|
|
1.9e-31 |
2.4e-22 |
6.4e-20 |
highlight_arrays | 0.000442 | -1.57 |
| Thaps_hclust_0022 |
|
|
1.9e-31 |
2.4e-22 |
6.4e-20 |
lowFe_KTKB_Day5 | 0.001320 | -0.682 |
| Thaps_hclust_0022 |
|
|
1.9e-31 |
2.4e-22 |
6.4e-20 |
BaP | 0.000370 | -0.734 |
| Thaps_hclust_0022 |
|
|
1.9e-31 |
2.4e-22 |
6.4e-20 |
exponential_vs_stationary_24highlight | 0.000526 | 0.356 |
| Thaps_hclust_0022 |
|
|
1.9e-31 |
2.4e-22 |
6.4e-20 |
co2_elevated_stat_arrays | 0.392000 | 0.164 |
| Thaps_hclust_0022 |
|
|
1.9e-31 |
2.4e-22 |
6.4e-20 |
lowtemp_TMEVA | 0.000735 | -3.34 |
| Thaps_hclust_0022 |
|
|
1.9e-31 |
2.4e-22 |
6.4e-20 |
highpH_TMEVA | 0.000725 | -0.62 |
| Thaps_hclust_0022 |
|
|
1.9e-31 |
2.4e-22 |
6.4e-20 |
co2_elevated_expo_arrays | 0.001390 | -0.333 |
| Title | Cluster Plot | Dendrogram | e-value | e-value | e-value | Condition | Condition FDR | Condition Difference |
|---|---|---|---|---|---|---|---|---|
| Thaps_hclust_0260 |
 |
 |
1.6e-36 |
9.1e-22 |
8.6e-22 |
diel_exponential_vs_stationary | 0.911000 | -0.035 |
| Thaps_hclust_0260 |
|
|
1.6e-36 |
9.1e-22 |
8.6e-22 |
lowSi_TMEVA | 1.000000 | -0.0448 |
| Thaps_hclust_0260 |
|
|
1.6e-36 |
9.1e-22 |
8.6e-22 |
highlight_arrays | 0.000442 | -0.766 |
| Thaps_hclust_0260 |
|
|
1.6e-36 |
9.1e-22 |
8.6e-22 |
diel_light_vs_dark | 0.646000 | -0.155 |
| Thaps_hclust_0260 |
|
|
1.6e-36 |
9.1e-22 |
8.6e-22 |
lowFe_KTKB_Day3 | 0.315000 | -0.323 |