Hierarchical Clusters
Displaying 101 - 200 of 7500
| Title | Cluster Plot | Dendrogram | e-value | e-value | e-value | Condition | Condition FDR | Condition Difference |
|---|---|---|---|---|---|---|---|---|
| Thaps_hclust_0105 |
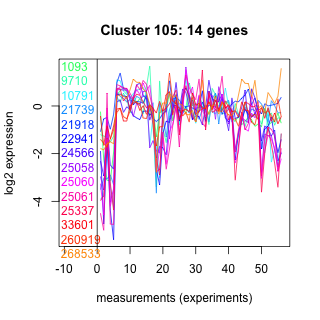 |
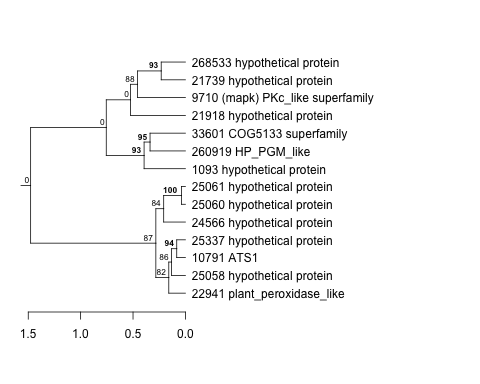 |
49 |
0.074 |
21 |
lowN_TMEVA | 0.001190 | -1.25 |
| Thaps_hclust_0105 |
|
|
49 |
0.074 |
21 |
diel_exponential_vs_stationary | 0.752000 | -0.0819 |
| Thaps_hclust_0105 |
|
|
49 |
0.074 |
21 |
lowSi_TMEVA | 0.001350 | -2.82 |
| Thaps_hclust_0105 |
|
|
49 |
0.074 |
21 |
highlight_arrays | 0.010400 | 0.481 |
| Thaps_hclust_0105 |
|
|
49 |
0.074 |
21 |
diel_light_vs_dark | 0.836000 | -0.0712 |
| Title | Cluster Plot | Dendrogram | e-value | e-value | e-value | Condition | Condition FDR | Condition Difference |
|---|---|---|---|---|---|---|---|---|
| Thaps_hclust_0307 |
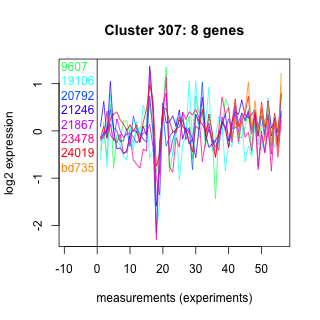 |
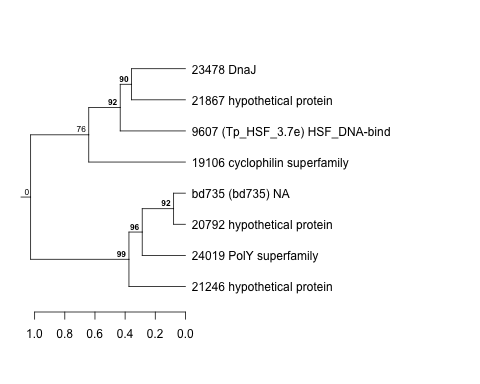 |
46 |
50 |
580 |
co2_elevated_expo_arrays | 0.985000 | -0.00834 |
| Thaps_hclust_0307 |
|
|
46 |
50 |
580 |
lowFe_TMEVA | 0.853000 | 0.0882 |
| Thaps_hclust_0307 |
|
|
46 |
50 |
580 |
exponential_vs_stationary_24light | 0.206000 | -0.587 |
| Thaps_hclust_0307 |
|
|
46 |
50 |
580 |
lowN_TMEVA | 0.725000 | -0.166 |
| Thaps_hclust_0307 |
|
|
46 |
50 |
580 |
diel_exponential_vs_stationary | 0.644000 | -0.142 |
| Thaps_hclust_0307 |
|
|
46 |
50 |
580 |
lowSi_TMEVA | 0.557000 | 0.447 |
| Thaps_hclust_0307 |
|
|
46 |
50 |
580 |
highlight_arrays | 0.697000 | 0.106 |
| Thaps_hclust_0307 |
|
|
46 |
50 |
580 |
diel_light_vs_dark | 0.703000 | -0.152 |
| Thaps_hclust_0307 |
|
|
46 |
50 |
580 |
lowFe_KTKB_Day3 | 0.087300 | 0.649 |
| Thaps_hclust_0307 |
|
|
46 |
50 |
580 |
lowFe_KTKB_Day5 | 0.787000 | 0.0945 |
| Thaps_hclust_0307 |
|
|
46 |
50 |
580 |
BaP | 0.383000 | -0.309 |
| Thaps_hclust_0307 |
|
|
46 |
50 |
580 |
exponential_vs_stationary_24highlight | 0.025800 | -0.38 |
| Thaps_hclust_0307 |
|
|
46 |
50 |
580 |
co2_elevated_stat_arrays | 0.691000 | 0.138 |
| Thaps_hclust_0307 |
|
|
46 |
50 |
580 |
lowtemp_TMEVA | 0.786000 | -0.117 |
| Thaps_hclust_0307 |
|
|
46 |
50 |
580 |
highpH_TMEVA | 0.344000 | -0.229 |
| Title | Cluster Plot | Dendrogram | e-value | e-value | e-value | Condition | Condition FDR | Condition Difference |
|---|---|---|---|---|---|---|---|---|
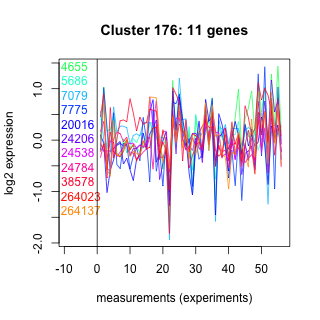
| Thaps_hclust_0176 |
 |
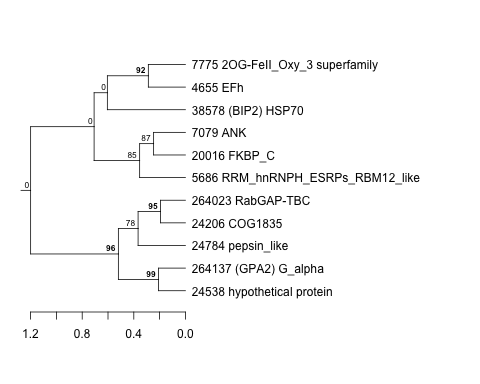 |
29 |
59 |
110 |
lowFe_KTKB_Day3 | 0.447000 | 0.254 |
| Thaps_hclust_0176 |
|
|
29 |
59 |
110 |
lowFe_KTKB_Day5 | 0.188000 | 0.353 |
| Thaps_hclust_0176 |
|
|
29 |
59 |
110 |
BaP | 0.823000 | -0.0801 |
| Thaps_hclust_0176 |
|
|
29 |
59 |
110 |
exponential_vs_stationary_24highlight | 0.034500 | 0.31 |
| Thaps_hclust_0176 |
|
|
29 |
59 |
110 |
co2_elevated_stat_arrays | 0.280000 | -0.305 |
| Thaps_hclust_0176 |
|
|
29 |
59 |
110 |
lowtemp_TMEVA | 0.733000 | 0.123 |
| Thaps_hclust_0176 |
|
|
29 |
59 |
110 |
highpH_TMEVA | 0.794000 | 0.0659 |
| Thaps_hclust_0176 |
|
|
29 |
59 |
110 |
co2_elevated_expo_arrays | 0.943000 | 0.0398 |
| Thaps_hclust_0176 |
|
|
29 |
59 |
110 |
lowFe_TMEVA | 0.300000 | 0.357 |
| Thaps_hclust_0176 |
|
|
29 |
59 |
110 |
exponential_vs_stationary_24light | 0.069700 | 0.731 |
| Thaps_hclust_0176 |
|
|
29 |
59 |
110 |
lowN_TMEVA | 0.355000 | -0.383 |
| Thaps_hclust_0176 |
|
|
29 |
59 |
110 |
diel_exponential_vs_stationary | 0.449000 | 0.19 |
| Thaps_hclust_0176 |
|
|
29 |
59 |
110 |
lowSi_TMEVA | 0.929000 | -0.164 |
| Thaps_hclust_0176 |
|
|
29 |
59 |
110 |
highlight_arrays | 0.129000 | -0.322 |
| Thaps_hclust_0176 |
|
|
29 |
59 |
110 |
diel_light_vs_dark | 0.119000 | 0.43 |
| Title | Cluster Plot | Dendrogram | e-value | e-value | e-value | Condition | Condition FDR | Condition Difference |
|---|---|---|---|---|---|---|---|---|
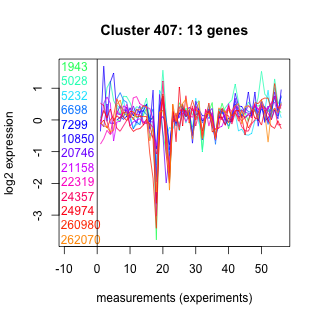
| Thaps_hclust_0407 |
 |
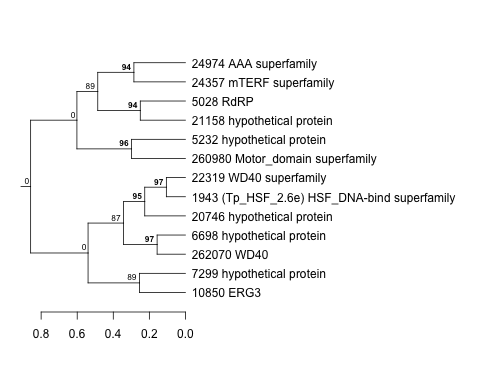 |
25 |
77 |
290 |
exponential_vs_stationary_24highlight | 0.329000 | -0.134 |
| Thaps_hclust_0407 |
|
|
25 |
77 |
290 |
co2_elevated_stat_arrays | 0.503000 | -0.183 |
| Thaps_hclust_0407 |
|
|
25 |
77 |
290 |
lowtemp_TMEVA | 0.786000 | 0.0967 |
| Thaps_hclust_0407 |
|
|
25 |
77 |
290 |
highpH_TMEVA | 0.551000 | -0.126 |
| Thaps_hclust_0407 |
|
|
25 |
77 |
290 |
co2_elevated_expo_arrays | 0.873000 | 0.0689 |
| Thaps_hclust_0407 |
|
|
25 |
77 |
290 |
lowFe_TMEVA | 0.432000 | 0.249 |
| Thaps_hclust_0407 |
|
|
25 |
77 |
290 |
exponential_vs_stationary_24light | 0.657000 | -0.198 |
| Thaps_hclust_0407 |
|
|
25 |
77 |
290 |
lowN_TMEVA | 0.708000 | 0.157 |
| Thaps_hclust_0407 |
|
|
25 |
77 |
290 |
diel_exponential_vs_stationary | 0.175000 | -0.302 |
| Thaps_hclust_0407 |
|
|
25 |
77 |
290 |
lowSi_TMEVA | 0.854000 | 0.212 |
| Thaps_hclust_0407 |
|
|
25 |
77 |
290 |
highlight_arrays | 0.489000 | -0.143 |
| Thaps_hclust_0407 |
|
|
25 |
77 |
290 |
diel_light_vs_dark | 0.385000 | 0.239 |
| Thaps_hclust_0407 |
|
|
25 |
77 |
290 |
lowFe_KTKB_Day3 | 0.478000 | -0.22 |
| Thaps_hclust_0407 |
|
|
25 |
77 |
290 |
lowFe_KTKB_Day5 | 0.420000 | -0.207 |
| Thaps_hclust_0407 |
|
|
25 |
77 |
290 |
BaP | 0.055800 | -0.487 |
| Title | Cluster Plot | Dendrogram | e-value | e-value | e-value | Condition | Condition FDR | Condition Difference |
|---|---|---|---|---|---|---|---|---|
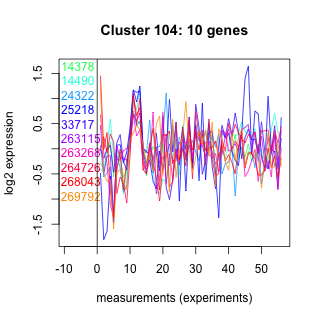
| Thaps_hclust_0104 |
 |
 |
23 |
24 |
220 |
diel_light_vs_dark | 0.557000 | -0.202 |
| Thaps_hclust_0104 |
|
|
23 |
24 |
220 |
lowFe_KTKB_Day3 | 0.991000 | 0.0064 |
| Thaps_hclust_0104 |
|
|
23 |
24 |
220 |
lowFe_KTKB_Day5 | 0.567000 | -0.171 |
| Thaps_hclust_0104 |
|
|
23 |
24 |
220 |
BaP | 0.567000 | -0.19 |
| Thaps_hclust_0104 |
|
|
23 |
24 |
220 |
exponential_vs_stationary_24highlight | 0.499000 | -0.107 |
| Thaps_hclust_0104 |
|
|
23 |
24 |
220 |
co2_elevated_stat_arrays | 0.835000 | 0.0676 |
| Thaps_hclust_0104 |
|
|
23 |
24 |
220 |
lowtemp_TMEVA | 0.016800 | -0.941 |
| Thaps_hclust_0104 |
|
|
23 |
24 |
220 |
highpH_TMEVA | 0.204000 | 0.276 |
| Thaps_hclust_0104 |
|
|
23 |
24 |
220 |
co2_elevated_expo_arrays | 0.805000 | -0.0934 |
| Thaps_hclust_0104 |
|
|
23 |
24 |
220 |
lowFe_TMEVA | 0.233000 | -0.432 |
| Thaps_hclust_0104 |
|
|
23 |
24 |
220 |
exponential_vs_stationary_24light | 0.626000 | -0.228 |
| Thaps_hclust_0104 |
|
|
23 |
24 |
220 |
lowN_TMEVA | 0.480000 | -0.305 |
| Thaps_hclust_0104 |
|
|
23 |
24 |
220 |
diel_exponential_vs_stationary | 0.779000 | -0.0813 |
| Thaps_hclust_0104 |
|
|
23 |
24 |
220 |
lowSi_TMEVA | 0.824000 | -0.251 |
| Thaps_hclust_0104 |
|
|
23 |
24 |
220 |
highlight_arrays | 0.486000 | 0.163 |
| Title | Cluster Plot | Dendrogram | e-value | e-value | e-value | Condition | Condition FDR | Condition Difference |
|---|---|---|---|---|---|---|---|---|
| Thaps_hclust_0109 |
 |
 |
17 |
32 |
5.5 |
exponential_vs_stationary_24highlight | 0.861000 | -0.0284 |
| Thaps_hclust_0109 |
|
|
17 |
32 |
5.5 |
co2_elevated_stat_arrays | 0.049000 | 0.516 |
| Thaps_hclust_0109 |
|
|
17 |
32 |
5.5 |
lowtemp_TMEVA | 0.125000 | 0.514 |
| Thaps_hclust_0109 |
|
|
17 |
32 |
5.5 |
highpH_TMEVA | 0.000725 | 0.834 |
| Thaps_hclust_0109 |
|
|
17 |
32 |
5.5 |
co2_elevated_expo_arrays | 0.969000 | -0.0245 |
| Thaps_hclust_0109 |
|
|
17 |
32 |
5.5 |
lowFe_TMEVA | 0.141000 | 0.5 |
| Thaps_hclust_0109 |
|
|
17 |
32 |
5.5 |
exponential_vs_stationary_24light | 0.984000 | -0.0077 |
| Thaps_hclust_0109 |
|
|
17 |
32 |
5.5 |
lowN_TMEVA | 0.279000 | -0.443 |
| Thaps_hclust_0109 |
|
|
17 |
32 |
5.5 |
diel_exponential_vs_stationary | 0.057400 | 0.44 |
| Thaps_hclust_0109 |
|
|
17 |
32 |
5.5 |
lowSi_TMEVA | 1.000000 | -0.0551 |
| Thaps_hclust_0109 |
|
|
17 |
32 |
5.5 |
highlight_arrays | 0.315000 | 0.207 |
| Thaps_hclust_0109 |
|
|
17 |
32 |
5.5 |
diel_light_vs_dark | 0.404000 | 0.241 |
| Thaps_hclust_0109 |
|
|
17 |
32 |
5.5 |
lowFe_KTKB_Day3 | 0.016000 | 0.718 |
| Thaps_hclust_0109 |
|
|
17 |
32 |
5.5 |
lowFe_KTKB_Day5 | 0.179000 | 0.351 |
| Thaps_hclust_0109 |
|
|
17 |
32 |
5.5 |
BaP | 0.005110 | 0.764 |
| Title | Cluster Plot | Dendrogram | e-value | e-value | e-value | Condition | Condition FDR | Condition Difference |
|---|---|---|---|---|---|---|---|---|
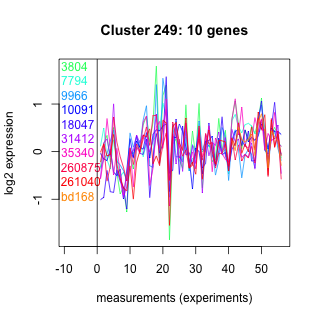
| Thaps_hclust_0249 |
 |
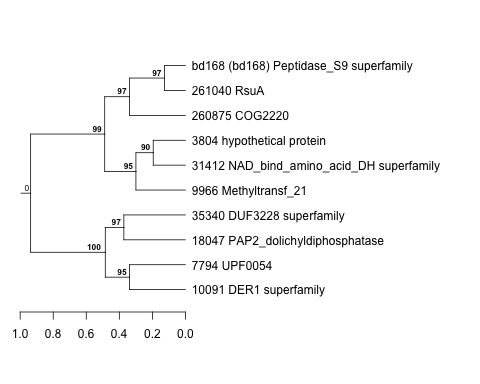 |
14 |
39 |
180 |
exponential_vs_stationary_24highlight | 0.456000 | 0.116 |
| Thaps_hclust_0249 |
|
|
14 |
39 |
180 |
co2_elevated_stat_arrays | 0.098900 | -0.471 |
| Thaps_hclust_0249 |
|
|
14 |
39 |
180 |
lowtemp_TMEVA | 0.646000 | 0.169 |
| Thaps_hclust_0249 |
|
|
14 |
39 |
180 |
highpH_TMEVA | 0.126000 | -0.332 |
| Thaps_hclust_0249 |
|
|
14 |
39 |
180 |
co2_elevated_expo_arrays | 0.873000 | -0.0718 |
| Thaps_hclust_0249 |
|
|
14 |
39 |
180 |
lowFe_TMEVA | 0.960000 | -0.0288 |
| Thaps_hclust_0249 |
|
|
14 |
39 |
180 |
exponential_vs_stationary_24light | 0.704000 | 0.186 |
| Title | Cluster Plot | Dendrogram | e-value | e-value | e-value | Condition | Condition FDR | Condition Difference |
|---|---|---|---|---|---|---|---|---|
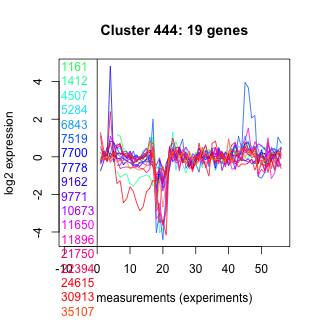
| Thaps_hclust_0444 |
 |
 |
14 |
140 |
1.6 |
co2_elevated_stat_arrays | 0.923000 | 0.0309 |
| Thaps_hclust_0444 |
|
|
14 |
140 |
1.6 |
lowtemp_TMEVA | 0.439000 | 0.206 |
| Thaps_hclust_0444 |
|
|
14 |
140 |
1.6 |
highpH_TMEVA | 0.607000 | 0.0951 |
| Thaps_hclust_0444 |
|
|
14 |
140 |
1.6 |
co2_elevated_expo_arrays | 0.944000 | -0.0348 |
| Thaps_hclust_0444 |
|
|
14 |
140 |
1.6 |
lowFe_TMEVA | 0.904000 | 0.0495 |
| Thaps_hclust_0444 |
|
|
14 |
140 |
1.6 |
exponential_vs_stationary_24light | 0.813000 | -0.101 |
| Thaps_hclust_0444 |
|
|
14 |
140 |
1.6 |
lowN_TMEVA | 0.967000 | 0.0165 |
| Title | Cluster Plot | Dendrogram | e-value | e-value | e-value | Condition | Condition FDR | Condition Difference |
|---|---|---|---|---|---|---|---|---|
| Thaps_hclust_0433 |
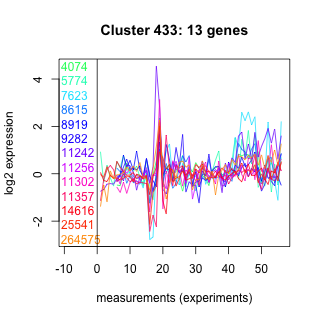 |
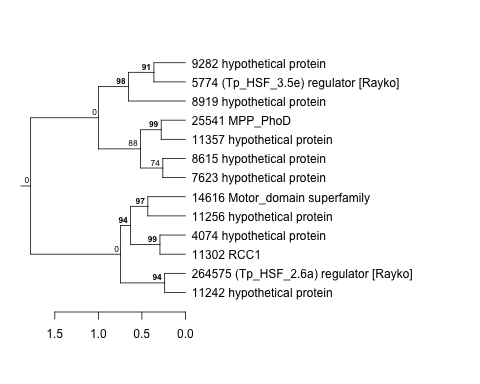 |
14 |
54 |
440 |
lowN_TMEVA | 0.661000 | -0.188 |
| Thaps_hclust_0433 |
|
|
14 |
54 |
440 |
diel_exponential_vs_stationary | 0.559000 | 0.146 |
| Thaps_hclust_0433 |
|
|
14 |
54 |
440 |
lowSi_TMEVA | 1.000000 | -0.0409 |
| Thaps_hclust_0433 |
|
|
14 |
54 |
440 |
highlight_arrays | 0.108000 | 0.312 |
| Thaps_hclust_0433 |
|
|
14 |
54 |
440 |
diel_light_vs_dark | 0.686000 | -0.13 |
| Thaps_hclust_0433 |
|
|
14 |
54 |
440 |
lowFe_KTKB_Day3 | 0.000862 | -1.11 |