Hierarchical Clusters
Displaying 1501 - 1600 of 7500
| Title | Cluster Plot | Dendrogram | e-value | e-value | e-value | Condition | Condition FDR | Condition Difference |
|---|---|---|---|---|---|---|---|---|
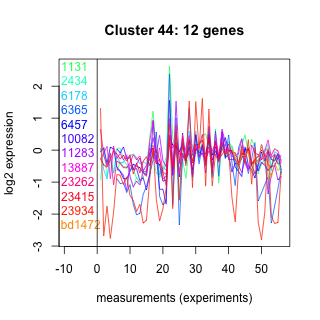
| Thaps_hclust_0044 |
 |
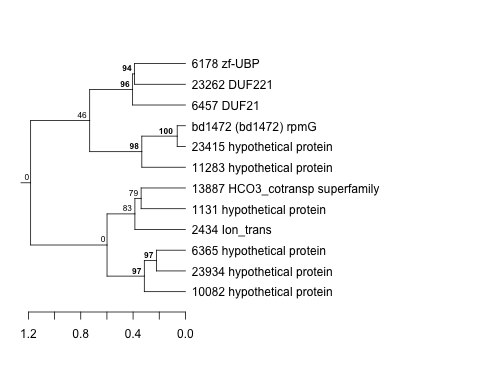 |
0.27 |
2.6 |
4.2 |
lowSi_TMEVA | 0.296000 | -0.618 |
| Thaps_hclust_0044 |
|
|
0.27 |
2.6 |
4.2 |
highlight_arrays | 0.238000 | 0.24 |
| Thaps_hclust_0044 |
|
|
0.27 |
2.6 |
4.2 |
diel_light_vs_dark | 0.001770 | -0.757 |
| Thaps_hclust_0044 |
|
|
0.27 |
2.6 |
4.2 |
lowFe_KTKB_Day3 | 0.454000 | -0.246 |
| Thaps_hclust_0044 |
|
|
0.27 |
2.6 |
4.2 |
BaP | 0.011100 | -0.709 |
| Thaps_hclust_0044 |
|
|
0.27 |
2.6 |
4.2 |
lowFe_KTKB_Day5 | 0.330000 | 0.254 |
| Thaps_hclust_0044 |
|
|
0.27 |
2.6 |
4.2 |
exponential_vs_stationary_24highlight | 0.960000 | -0.0113 |
| Thaps_hclust_0044 |
|
|
0.27 |
2.6 |
4.2 |
co2_elevated_stat_arrays | 0.694000 | 0.122 |
| Thaps_hclust_0044 |
|
|
0.27 |
2.6 |
4.2 |
lowtemp_TMEVA | 0.073900 | -0.614 |
| Thaps_hclust_0044 |
|
|
0.27 |
2.6 |
4.2 |
highpH_TMEVA | 0.771000 | 0.0706 |
| Thaps_hclust_0044 |
|
|
0.27 |
2.6 |
4.2 |
co2_elevated_expo_arrays | 1.000000 | 0.00173 |
| Thaps_hclust_0044 |
|
|
0.27 |
2.6 |
4.2 |
lowFe_TMEVA | 0.097300 | -0.55 |
| Thaps_hclust_0044 |
|
|
0.27 |
2.6 |
4.2 |
exponential_vs_stationary_24light | 0.777000 | -0.14 |
| Thaps_hclust_0044 |
|
|
0.27 |
2.6 |
4.2 |
lowN_TMEVA | 0.090400 | -0.689 |
| Thaps_hclust_0044 |
|
|
0.27 |
2.6 |
4.2 |
diel_exponential_vs_stationary | 0.813000 | 0.0649 |
| Title | Cluster Plot | Dendrogram | e-value | e-value | e-value | Condition | Condition FDR | Condition Difference |
|---|---|---|---|---|---|---|---|---|
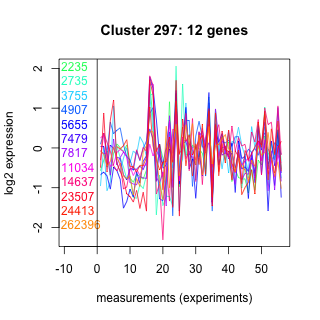
| Thaps_hclust_0297 |
 |
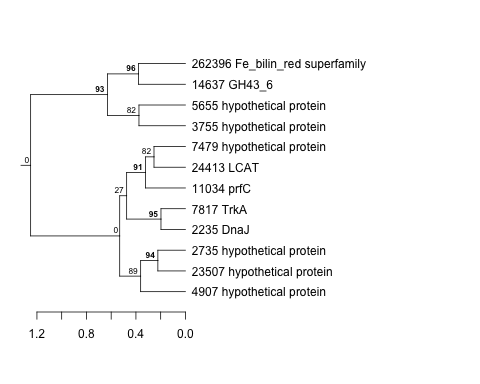 |
0.018 |
2.5 |
24 |
lowFe_KTKB_Day3 | 0.000862 | 1.17 |
| Thaps_hclust_0297 |
|
|
0.018 |
2.5 |
24 |
lowFe_KTKB_Day5 | 0.003410 | 0.832 |
| Thaps_hclust_0297 |
|
|
0.018 |
2.5 |
24 |
BaP | 0.032100 | -0.595 |
| Thaps_hclust_0297 |
|
|
0.018 |
2.5 |
24 |
exponential_vs_stationary_24highlight | 0.022000 | 0.323 |
| Thaps_hclust_0297 |
|
|
0.018 |
2.5 |
24 |
co2_elevated_stat_arrays | 0.807000 | -0.0761 |
| Thaps_hclust_0297 |
|
|
0.018 |
2.5 |
24 |
lowtemp_TMEVA | 0.695000 | 0.138 |
| Thaps_hclust_0297 |
|
|
0.018 |
2.5 |
24 |
highpH_TMEVA | 0.165000 | -0.278 |
| Thaps_hclust_0297 |
|
|
0.018 |
2.5 |
24 |
co2_elevated_expo_arrays | 0.178000 | 0.253 |
| Thaps_hclust_0297 |
|
|
0.018 |
2.5 |
24 |
lowFe_TMEVA | 0.857000 | 0.0759 |
| Thaps_hclust_0297 |
|
|
0.018 |
2.5 |
24 |
exponential_vs_stationary_24light | 0.072000 | 0.685 |
| Thaps_hclust_0297 |
|
|
0.018 |
2.5 |
24 |
lowN_TMEVA | 0.360000 | -0.372 |
| Thaps_hclust_0297 |
|
|
0.018 |
2.5 |
24 |
diel_exponential_vs_stationary | 0.960000 | 0.0179 |
| Thaps_hclust_0297 |
|
|
0.018 |
2.5 |
24 |
lowSi_TMEVA | 0.788000 | -0.274 |
| Thaps_hclust_0297 |
|
|
0.018 |
2.5 |
24 |
highlight_arrays | 0.133000 | -0.295 |
| Thaps_hclust_0297 |
|
|
0.018 |
2.5 |
24 |
diel_light_vs_dark | 0.033500 | -0.539 |
| Title | Cluster Plot | Dendrogram | e-value | e-value | e-value | Condition | Condition FDR | Condition Difference |
|---|---|---|---|---|---|---|---|---|
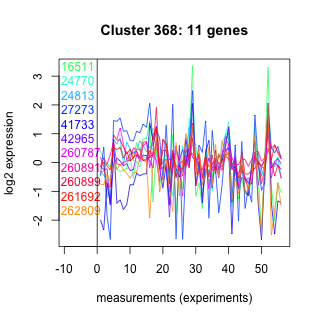
| Thaps_hclust_0368 |
 |
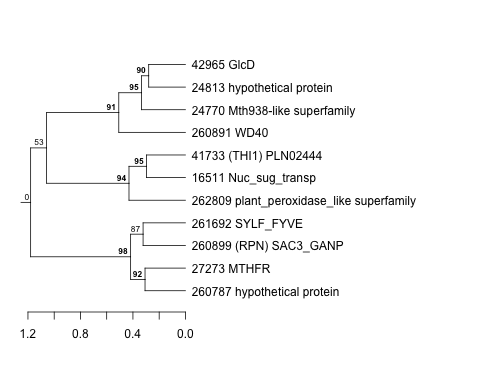 |
0.0078 |
2.5 |
3.1 |
diel_light_vs_dark | 0.224000 | 0.347 |
| Thaps_hclust_0368 |
|
|
0.0078 |
2.5 |
3.1 |
lowFe_KTKB_Day3 | 0.149000 | 0.453 |
| Thaps_hclust_0368 |
|
|
0.0078 |
2.5 |
3.1 |
lowFe_KTKB_Day5 | 0.274000 | 0.295 |
| Thaps_hclust_0368 |
|
|
0.0078 |
2.5 |
3.1 |
BaP | 0.449000 | 0.233 |
| Thaps_hclust_0368 |
|
|
0.0078 |
2.5 |
3.1 |
exponential_vs_stationary_24highlight | 0.000526 | -0.588 |
| Thaps_hclust_0368 |
|
|
0.0078 |
2.5 |
3.1 |
co2_elevated_stat_arrays | 0.000658 | 0.971 |
| Thaps_hclust_0368 |
|
|
0.0078 |
2.5 |
3.1 |
lowtemp_TMEVA | 0.082900 | 0.598 |
| Thaps_hclust_0368 |
|
|
0.0078 |
2.5 |
3.1 |
highpH_TMEVA | 0.079900 | -0.361 |
| Thaps_hclust_0368 |
|
|
0.0078 |
2.5 |
3.1 |
co2_elevated_expo_arrays | 0.545000 | 0.154 |
| Thaps_hclust_0368 |
|
|
0.0078 |
2.5 |
3.1 |
lowFe_TMEVA | 0.316000 | -0.341 |
| Thaps_hclust_0368 |
|
|
0.0078 |
2.5 |
3.1 |
exponential_vs_stationary_24light | 0.750000 | -0.158 |
| Thaps_hclust_0368 |
|
|
0.0078 |
2.5 |
3.1 |
lowN_TMEVA | 0.139000 | -0.607 |
| Thaps_hclust_0368 |
|
|
0.0078 |
2.5 |
3.1 |
diel_exponential_vs_stationary | 0.012600 | -0.617 |
| Thaps_hclust_0368 |
|
|
0.0078 |
2.5 |
3.1 |
lowSi_TMEVA | 0.065500 | -0.932 |
| Thaps_hclust_0368 |
|
|
0.0078 |
2.5 |
3.1 |
highlight_arrays | 0.303000 | -0.223 |
| Title | Cluster Plot | Dendrogram | e-value | e-value | e-value | Condition | Condition FDR | Condition Difference |
|---|---|---|---|---|---|---|---|---|
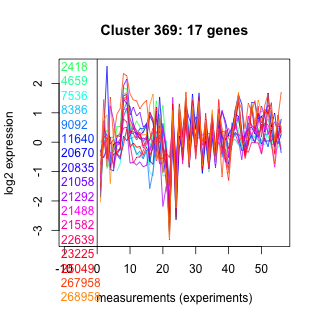
| Thaps_hclust_0369 |
 |
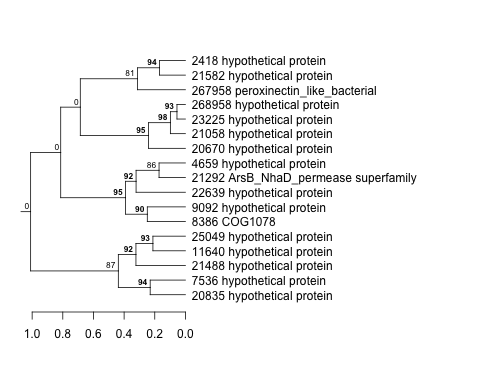 |
0.34 |
2.4 |
5 |
diel_light_vs_dark | 0.000485 | 1.32 |
| Thaps_hclust_0369 |
|
|
0.34 |
2.4 |
5 |
lowFe_KTKB_Day3 | 0.811000 | -0.0717 |
| Thaps_hclust_0369 |
|
|
0.34 |
2.4 |
5 |
lowFe_KTKB_Day5 | 0.689000 | 0.0944 |
| Thaps_hclust_0369 |
|
|
0.34 |
2.4 |
5 |
BaP | 0.562000 | -0.153 |
| Thaps_hclust_0369 |
|
|
0.34 |
2.4 |
5 |
exponential_vs_stationary_24highlight | 0.924000 | -0.0156 |
| Thaps_hclust_0369 |
|
|
0.34 |
2.4 |
5 |
co2_elevated_stat_arrays | 0.774000 | 0.0816 |
| Thaps_hclust_0369 |
|
|
0.34 |
2.4 |
5 |
lowtemp_TMEVA | 0.520000 | -0.181 |
| Thaps_hclust_0369 |
|
|
0.34 |
2.4 |
5 |
highpH_TMEVA | 0.000725 | -1.04 |
| Thaps_hclust_0369 |
|
|
0.34 |
2.4 |
5 |
co2_elevated_expo_arrays | 0.016400 | 0.333 |
| Thaps_hclust_0369 |
|
|
0.34 |
2.4 |
5 |
lowFe_TMEVA | 0.215000 | 0.368 |
| Thaps_hclust_0369 |
|
|
0.34 |
2.4 |
5 |
exponential_vs_stationary_24light | 0.791000 | 0.116 |
| Thaps_hclust_0369 |
|
|
0.34 |
2.4 |
5 |
lowN_TMEVA | 0.818000 | 0.091 |
| Thaps_hclust_0369 |
|
|
0.34 |
2.4 |
5 |
diel_exponential_vs_stationary | 0.000602 | -0.626 |
| Thaps_hclust_0369 |
|
|
0.34 |
2.4 |
5 |
lowSi_TMEVA | 0.918000 | -0.176 |
| Thaps_hclust_0369 |
|
|
0.34 |
2.4 |
5 |
highlight_arrays | 0.881000 | -0.0299 |
| Title | Cluster Plot | Dendrogram | e-value | e-value | e-value | Condition | Condition FDR | Condition Difference |
|---|---|---|---|---|---|---|---|---|
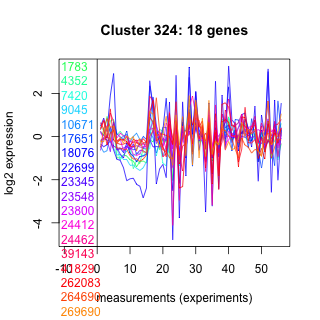
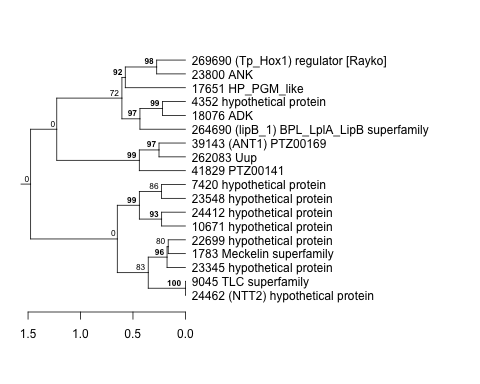
| Thaps_hclust_0324 |
 |
 |
0.0023 |
2.4 |
5.1 |
co2_elevated_expo_arrays | 0.911000 | 0.051 |
| Thaps_hclust_0324 |
|
|
0.0023 |
2.4 |
5.1 |
lowFe_TMEVA | 0.810000 | 0.0981 |
| Thaps_hclust_0324 |
|
|
0.0023 |
2.4 |
5.1 |
exponential_vs_stationary_24light | 0.012300 | -0.796 |
| Thaps_hclust_0324 |
|
|
0.0023 |
2.4 |
5.1 |
lowN_TMEVA | 0.842000 | 0.0849 |
| Thaps_hclust_0324 |
|
|
0.0023 |
2.4 |
5.1 |
diel_exponential_vs_stationary | 0.004950 | -0.537 |
| Thaps_hclust_0324 |
|
|
0.0023 |
2.4 |
5.1 |
lowSi_TMEVA | 0.723000 | 0.288 |
| Thaps_hclust_0324 |
|
|
0.0023 |
2.4 |
5.1 |
highlight_arrays | 0.173000 | 0.228 |
| Thaps_hclust_0324 |
|
|
0.0023 |
2.4 |
5.1 |
diel_light_vs_dark | 0.000485 | -1.31 |
| Thaps_hclust_0324 |
|
|
0.0023 |
2.4 |
5.1 |
lowFe_KTKB_Day3 | 0.007430 | 0.624 |
| Thaps_hclust_0324 |
|
|
0.0023 |
2.4 |
5.1 |
lowFe_KTKB_Day5 | 0.001320 | 0.767 |
| Thaps_hclust_0324 |
|
|
0.0023 |
2.4 |
5.1 |
BaP | 0.357000 | -0.223 |
| Thaps_hclust_0324 |
|
|
0.0023 |
2.4 |
5.1 |
exponential_vs_stationary_24highlight | 0.094600 | -0.187 |
| Thaps_hclust_0324 |
|
|
0.0023 |
2.4 |
5.1 |
co2_elevated_stat_arrays | 0.100000 | 0.378 |
| Thaps_hclust_0324 |
|
|
0.0023 |
2.4 |
5.1 |
lowtemp_TMEVA | 0.158000 | 0.38 |
| Thaps_hclust_0324 |
|
|
0.0023 |
2.4 |
5.1 |
highpH_TMEVA | 0.977000 | 0.0109 |
| Title | Cluster Plot | Dendrogram | e-value | e-value | e-value | Condition | Condition FDR | Condition Difference |
|---|---|---|---|---|---|---|---|---|
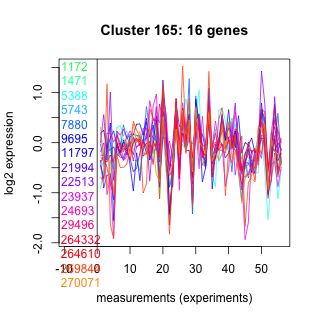
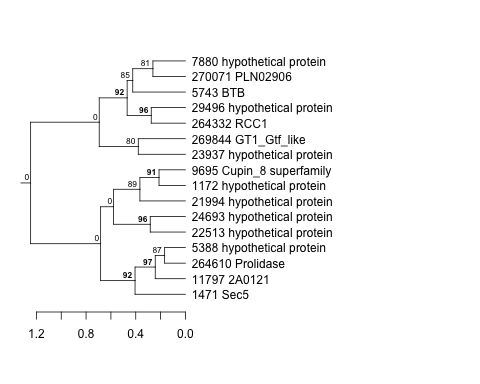
| Thaps_hclust_0165 |
 |
 |
0.00011 |
2.3 |
3.9 |
lowFe_KTKB_Day3 | 0.926000 | 0.0344 |
| Thaps_hclust_0165 |
|
|
0.00011 |
2.3 |
3.9 |
lowFe_KTKB_Day5 | 0.630000 | 0.116 |
| Thaps_hclust_0165 |
|
|
0.00011 |
2.3 |
3.9 |
BaP | 0.653000 | 0.123 |
| Thaps_hclust_0165 |
|
|
0.00011 |
2.3 |
3.9 |
exponential_vs_stationary_24highlight | 0.751000 | 0.0431 |
| Thaps_hclust_0165 |
|
|
0.00011 |
2.3 |
3.9 |
co2_elevated_stat_arrays | 0.006700 | -0.6 |
| Thaps_hclust_0165 |
|
|
0.00011 |
2.3 |
3.9 |
lowtemp_TMEVA | 0.011200 | -0.777 |
| Thaps_hclust_0165 |
|
|
0.00011 |
2.3 |
3.9 |
highpH_TMEVA | 0.189000 | -0.226 |
| Thaps_hclust_0165 |
|
|
0.00011 |
2.3 |
3.9 |
co2_elevated_expo_arrays | 0.873000 | 0.0681 |
| Thaps_hclust_0165 |
|
|
0.00011 |
2.3 |
3.9 |
lowFe_TMEVA | 0.288000 | -0.325 |
| Thaps_hclust_0165 |
|
|
0.00011 |
2.3 |
3.9 |
exponential_vs_stationary_24light | 0.982000 | 0.0125 |
| Thaps_hclust_0165 |
|
|
0.00011 |
2.3 |
3.9 |
lowN_TMEVA | 0.564000 | -0.227 |
| Thaps_hclust_0165 |
|
|
0.00011 |
2.3 |
3.9 |
diel_exponential_vs_stationary | 0.458000 | -0.16 |
| Thaps_hclust_0165 |
|
|
0.00011 |
2.3 |
3.9 |
lowSi_TMEVA | 0.806000 | -0.256 |
| Title | Cluster Plot | Dendrogram | e-value | e-value | e-value | Condition | Condition FDR | Condition Difference |
|---|---|---|---|---|---|---|---|---|
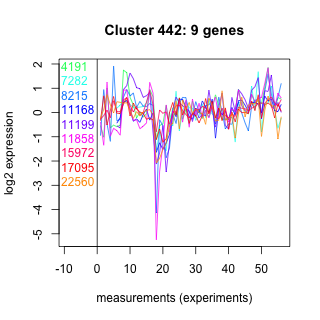
| Thaps_hclust_0442 |
 |
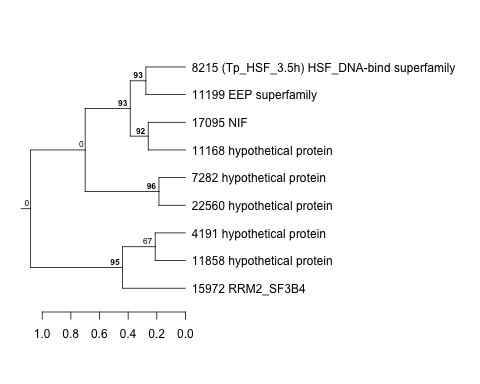 |
0.045 |
2.3 |
2.8 |
BaP | 0.000370 | -1.3 |
| Thaps_hclust_0442 |
|
|
0.045 |
2.3 |
2.8 |
exponential_vs_stationary_24highlight | 0.240000 | 0.187 |
| Thaps_hclust_0442 |
|
|
0.045 |
2.3 |
2.8 |
co2_elevated_stat_arrays | 0.051300 | 0.573 |
| Thaps_hclust_0442 |
|
|
0.045 |
2.3 |
2.8 |
lowtemp_TMEVA | 0.388000 | 0.311 |
| Thaps_hclust_0442 |
|
|
0.045 |
2.3 |
2.8 |
highpH_TMEVA | 0.052400 | -0.453 |
| Thaps_hclust_0442 |
|
|
0.045 |
2.3 |
2.8 |
co2_elevated_expo_arrays | 0.802000 | 0.099 |
| Thaps_hclust_0442 |
|
|
0.045 |
2.3 |
2.8 |
lowFe_TMEVA | 0.795000 | -0.122 |
| Thaps_hclust_0442 |
|
|
0.045 |
2.3 |
2.8 |
exponential_vs_stationary_24light | 0.684000 | 0.209 |
| Thaps_hclust_0442 |
|
|
0.045 |
2.3 |
2.8 |
lowN_TMEVA | 0.436000 | 0.349 |
| Thaps_hclust_0442 |
|
|
0.045 |
2.3 |
2.8 |
diel_exponential_vs_stationary | 0.896000 | 0.0453 |
| Thaps_hclust_0442 |
|
|
0.045 |
2.3 |
2.8 |
lowSi_TMEVA | 0.557000 | -0.435 |
| Thaps_hclust_0442 |
|
|
0.045 |
2.3 |
2.8 |
highlight_arrays | 0.311000 | -0.241 |