Hierarchical Clusters
Displaying 201 - 300 of 7500
| Title | Cluster Plot | Dendrogram | e-value | e-value | e-value | Condition | Condition FDR | Condition Difference |
|---|---|---|---|---|---|---|---|---|
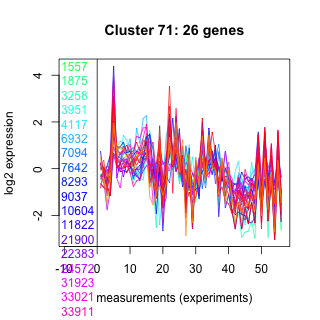
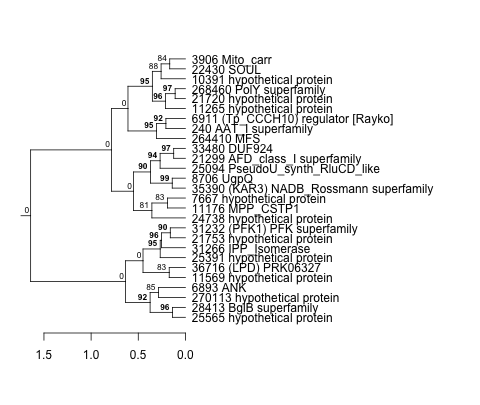
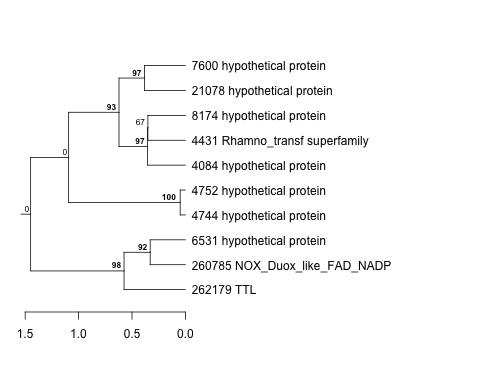
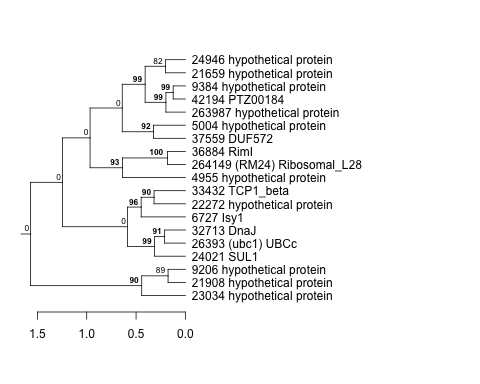
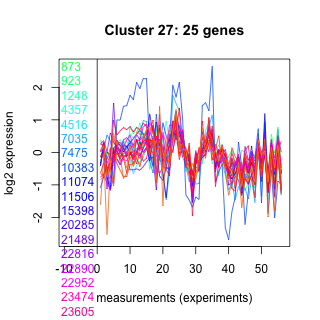
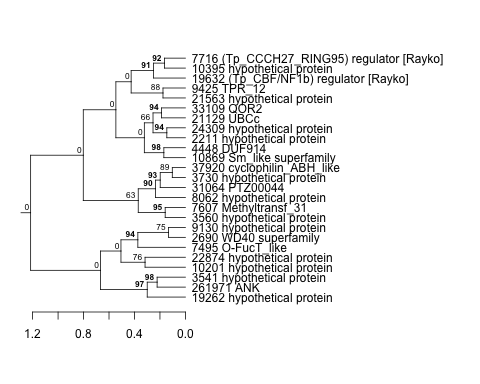
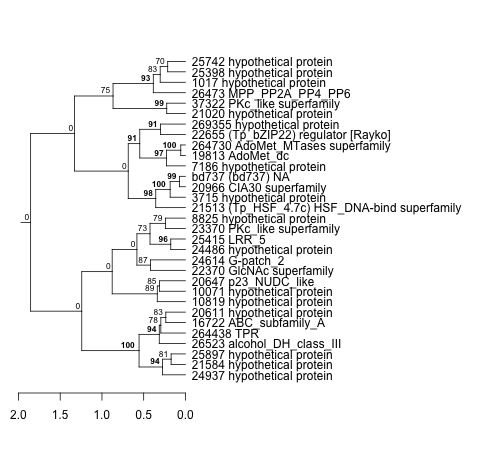
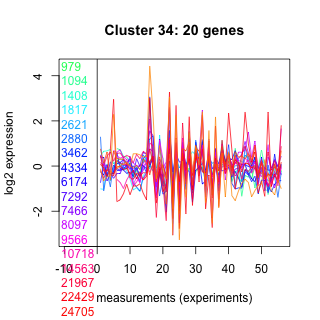
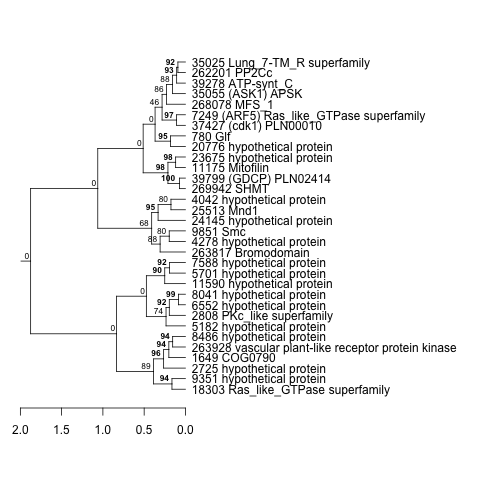
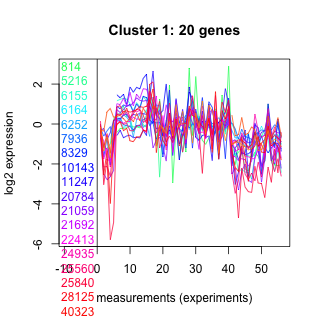
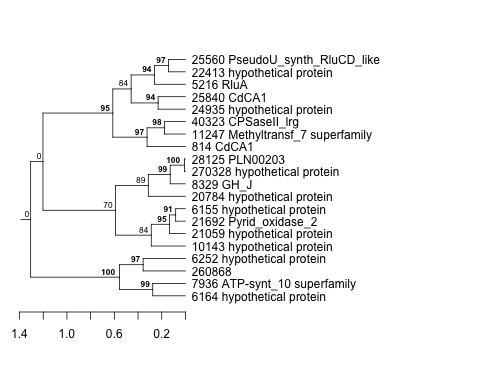
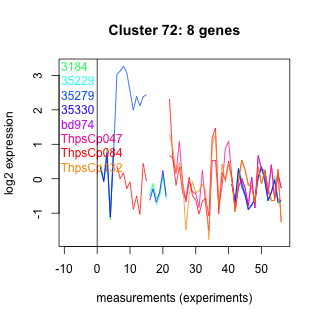
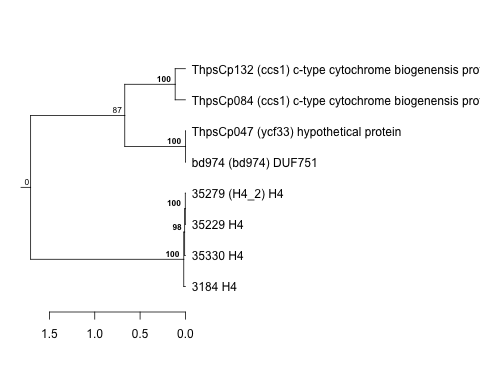
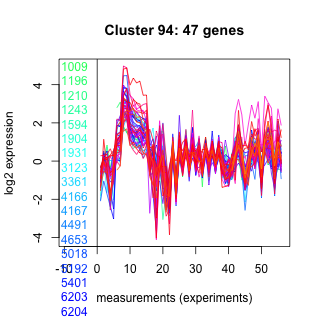
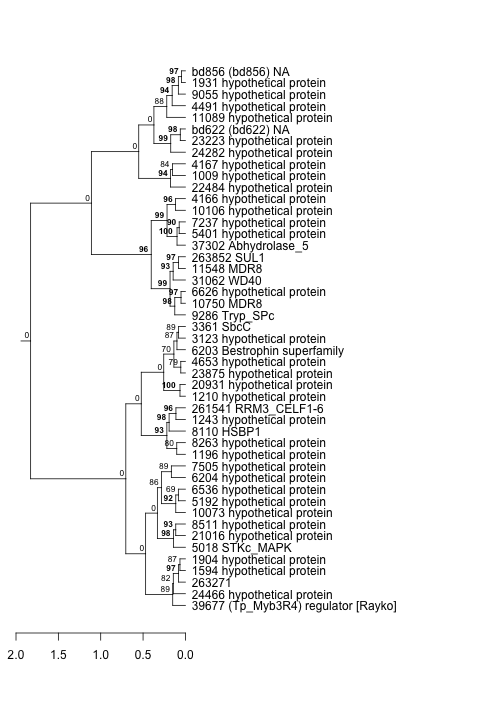
| Thaps_hclust_0071 |
 |
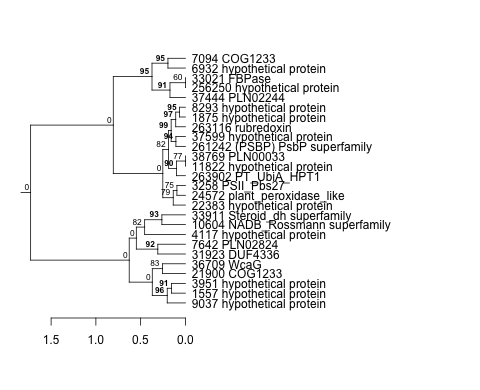 |
0.0000019 |
0.0000028 |
0.00008 |
diel_exponential_vs_stationary | 0.000602 | 0.995 |
| Title | Cluster Plot | Dendrogram | e-value | e-value | e-value | Condition | Condition FDR | Condition Difference |
|---|---|---|---|---|---|---|---|---|
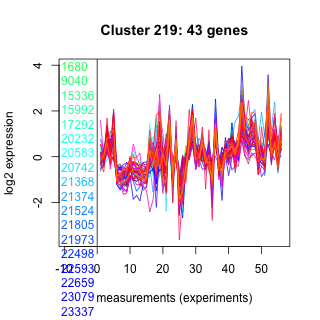
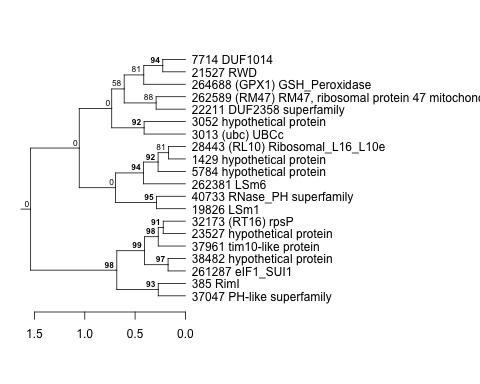
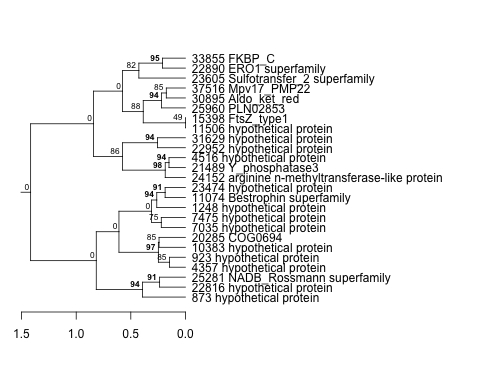
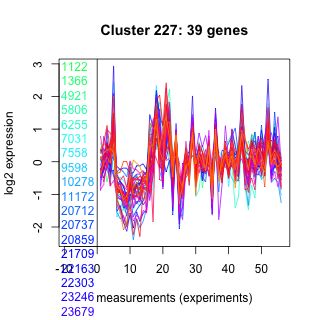
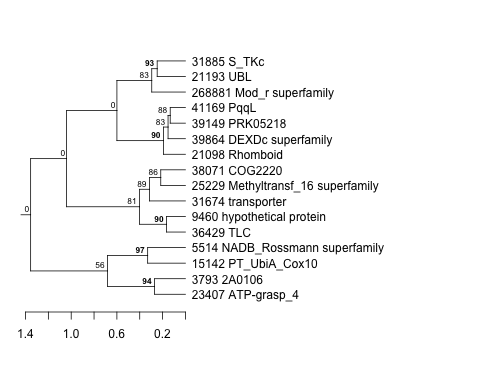
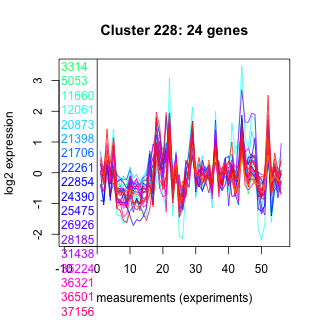
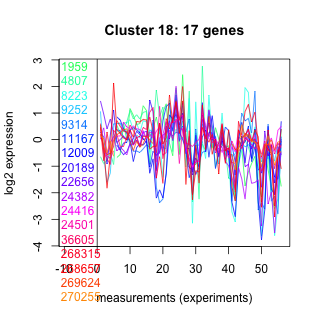
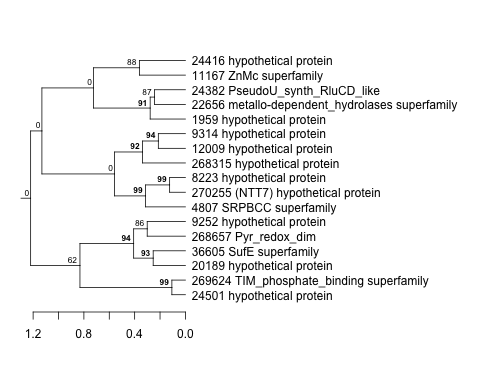
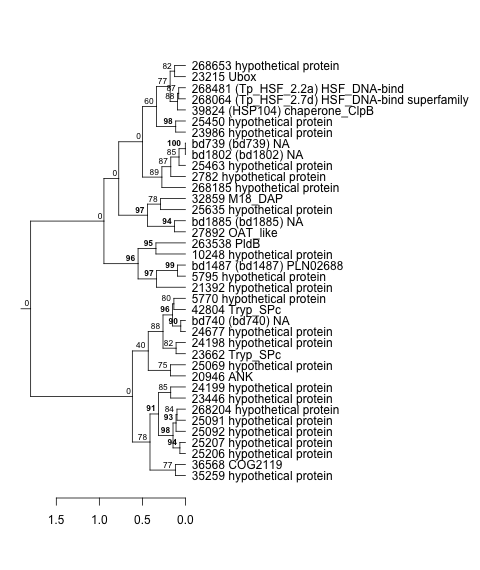
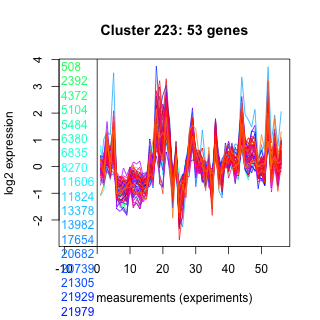
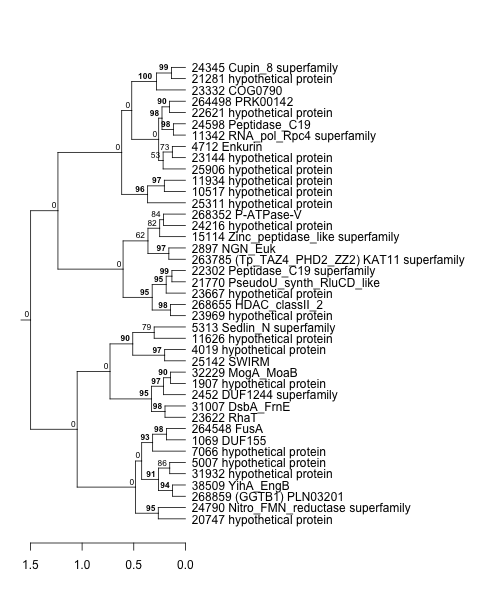
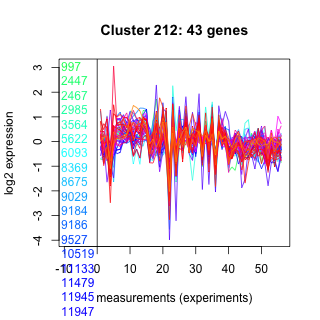
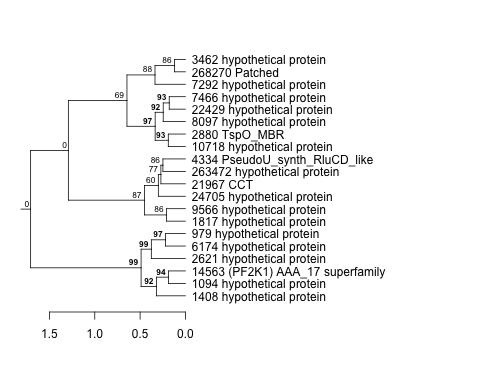
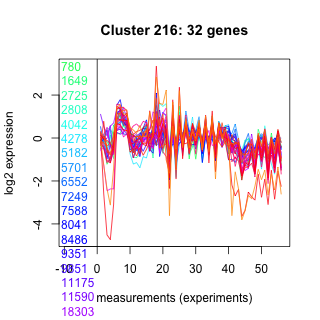
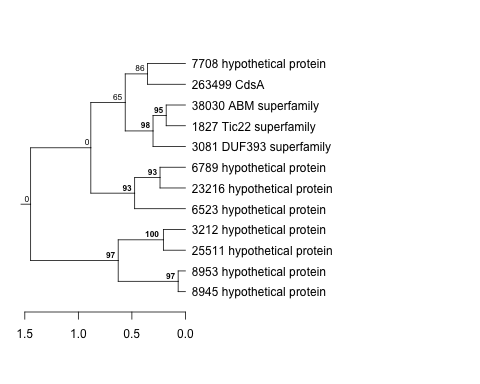
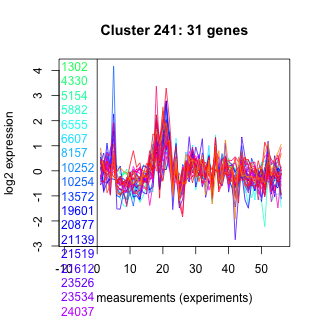
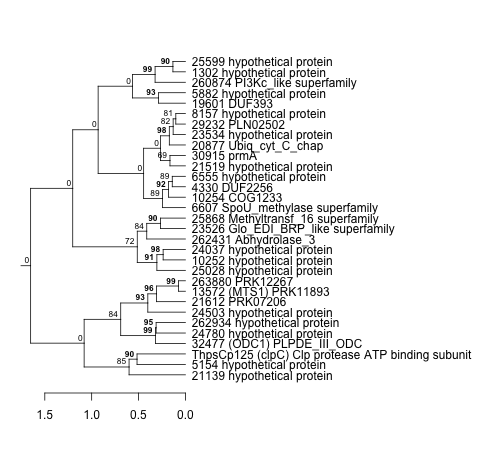
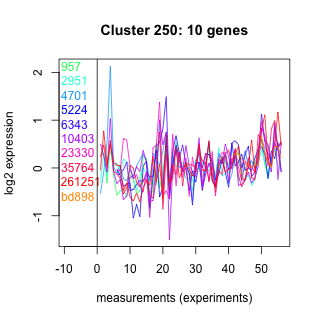
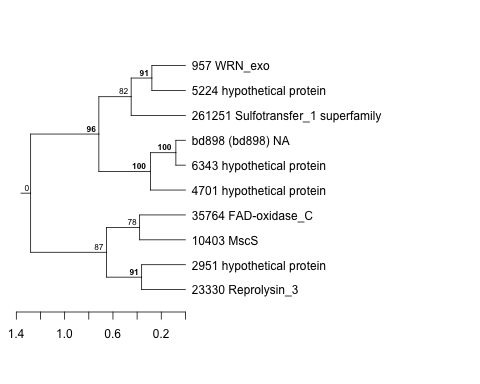
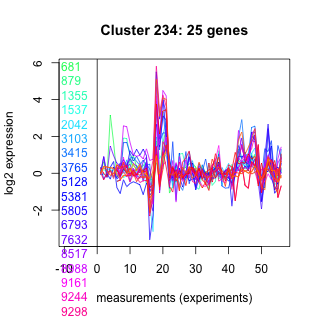
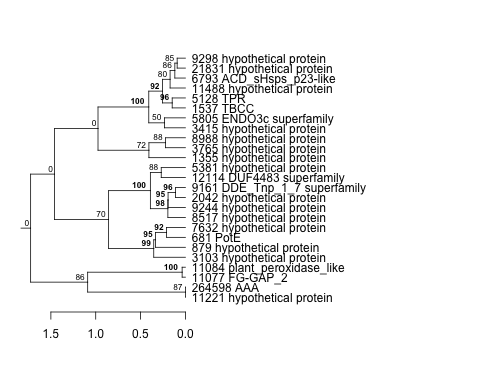
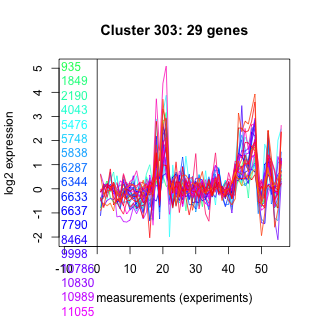
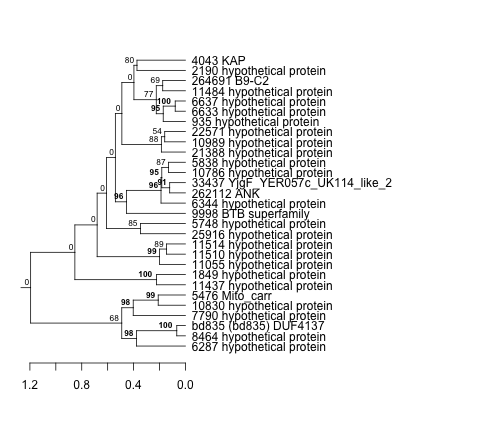
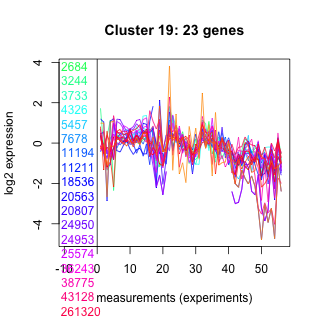
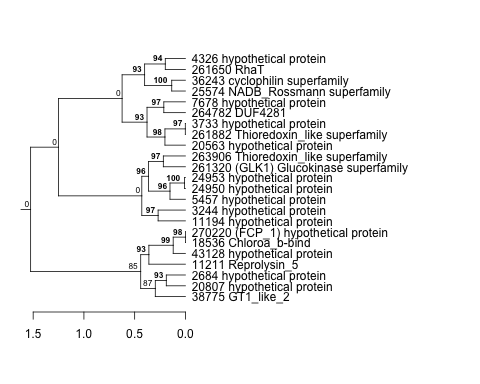
| Thaps_hclust_0219 |
 |
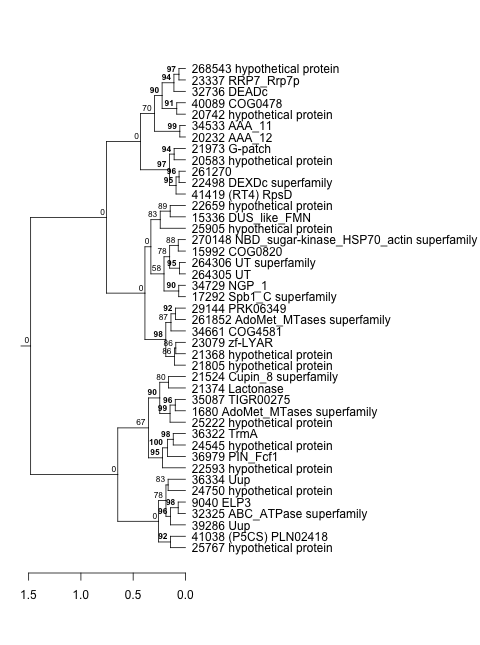 |
2.8e-16 |
0.0000000055 |
0.012 |
co2_elevated_stat_arrays | 0.000658 | 0.994 |
| Title | Cluster Plot | Dendrogram | e-value | e-value | e-value | Condition | Condition FDR | Condition Difference |
|---|---|---|---|---|---|---|---|---|
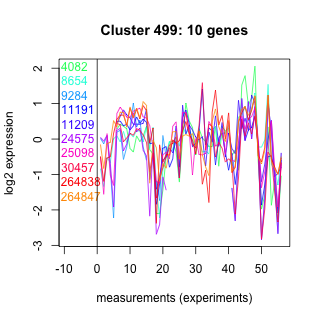
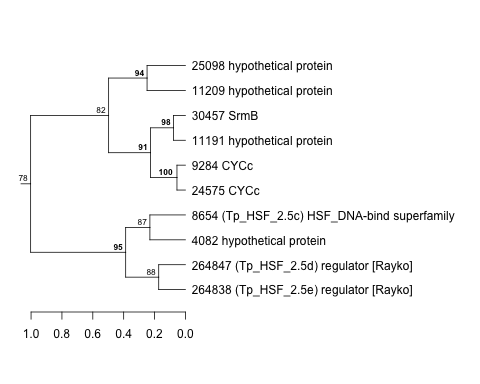
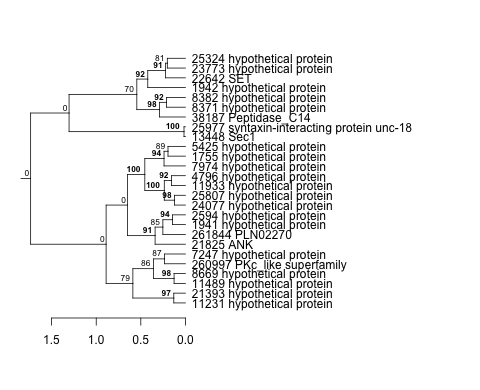
| Thaps_hclust_0499 |
 |
 |
0.13 |
5.4 |
18 |
highlight_arrays | 0.000442 | 0.993 |
| Title | Cluster Plot | Dendrogram | e-value | e-value | e-value | Condition | Condition FDR | Condition Difference |
|---|---|---|---|---|---|---|---|---|
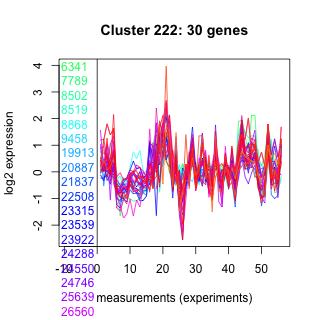
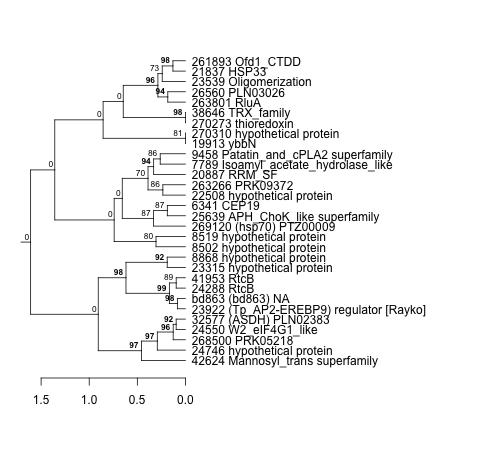
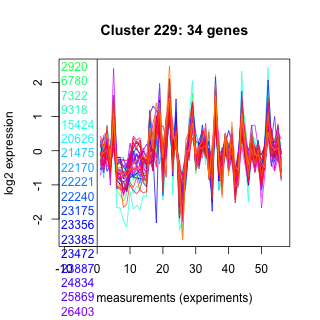
| Thaps_hclust_0222 |
 |
 |
0.0000000000016 |
0.000000011 |
0.0008 |
co2_elevated_stat_arrays | 0.000658 | 0.989 |
| Title | Cluster Plot | Dendrogram | e-value | e-value | e-value | Condition | Condition FDR | Condition Difference |
|---|---|---|---|---|---|---|---|---|
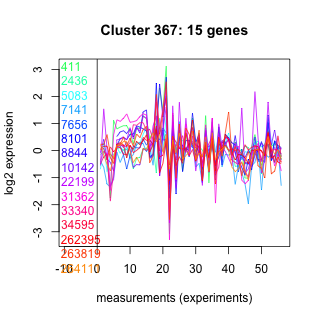
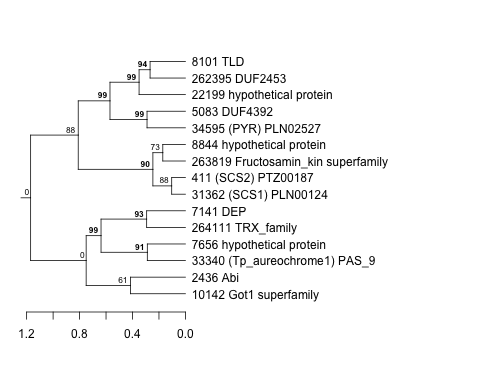
| Thaps_hclust_0330 |
 |
 |
0.0000058 |
0.00000085 |
0.000041 |
highlight_arrays | 0.000442 | 0.989 |
| Title | Cluster Plot | Dendrogram | e-value | e-value | e-value | Condition | Condition FDR | Condition Difference |
|---|---|---|---|---|---|---|---|---|
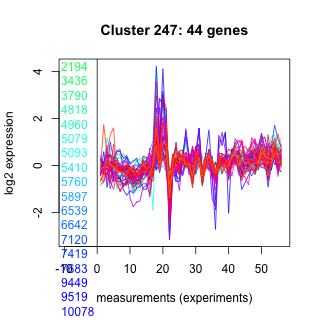
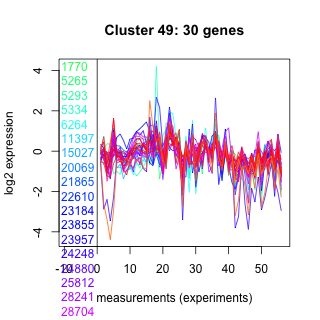
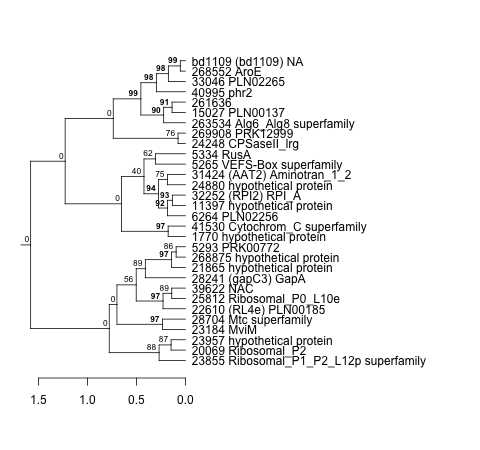
| Thaps_hclust_0247 |
 |
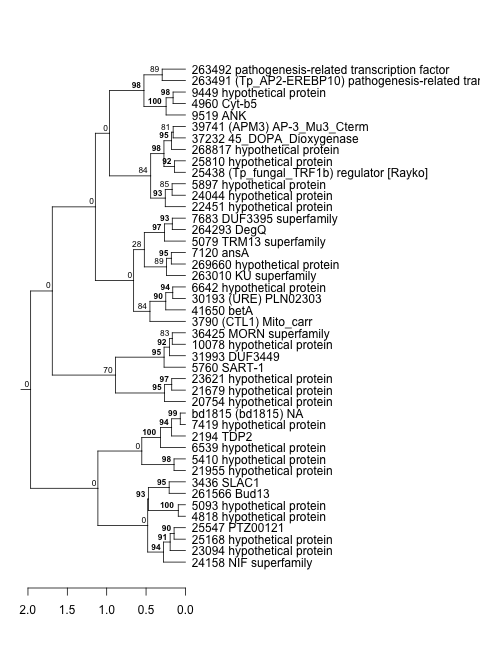 |
8.7e-16 |
0.00000000045 |
0.0000019 |
BaP | 0.000370 | 0.988 |
| Title | Cluster Plot | Dendrogram | e-value | e-value | e-value | Condition | Condition FDR | Condition Difference |
|---|---|---|---|---|---|---|---|---|
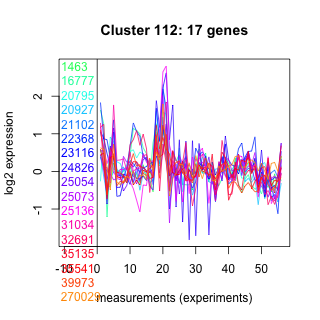
| Thaps_hclust_0112 |
 |
 |
0.00000035 |
0.017 |
0.34 |
BaP | 0.000370 | 0.987 |
| Title | Cluster Plot | Dendrogram | e-value | e-value | e-value | Condition | Condition FDR | Condition Difference |
|---|---|---|---|---|---|---|---|---|
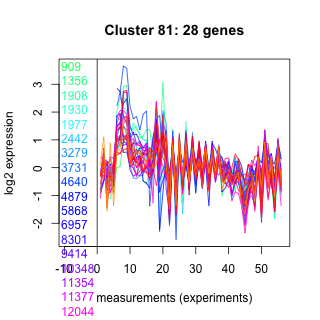
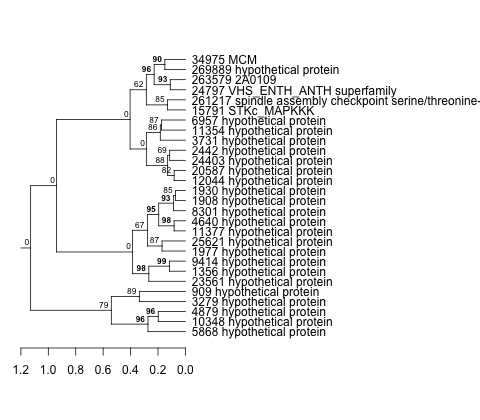
| Thaps_hclust_0082 |
 |
|
8.89825e-43 |
2e-27 |
1.3e-16 |
lowFe_KTKB_Day3 | 0.000862 | 0.987 |
| Title | Cluster Plot | Dendrogram | e-value | e-value | e-value | Condition | Condition FDR | Condition Difference |
|---|---|---|---|---|---|---|---|---|
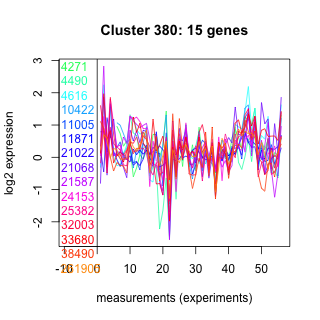
| Thaps_hclust_0380 |
 |
 |
1.1 |
5 |
8.7 |
lowSi_TMEVA | 0.023200 | 0.984 |
| Title | Cluster Plot | Dendrogram | e-value | e-value | e-value | Condition | Condition FDR | Condition Difference |
|---|---|---|---|---|---|---|---|---|
| Thaps_hclust_0030 |
 |
 |
0.000056 |
0.048 |
0.088 |
exponential_vs_stationary_24light | 0.000581 | 0.974 |
| Title | Cluster Plot | Dendrogram | e-value | e-value | e-value | Condition | Condition FDR | Condition Difference |
|---|---|---|---|---|---|---|---|---|
| Thaps_hclust_0052 |
 |
 |
1.4e-22 |
3.3e-19 |
0.0000000000037 |
BaP | 0.000370 | 0.974 |
| Title | Cluster Plot | Dendrogram | e-value | e-value | e-value | Condition | Condition FDR | Condition Difference |
|---|---|---|---|---|---|---|---|---|
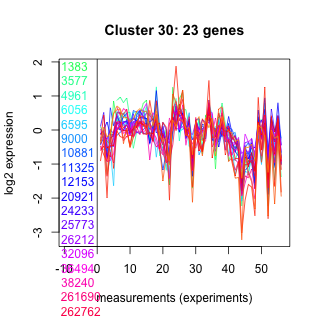
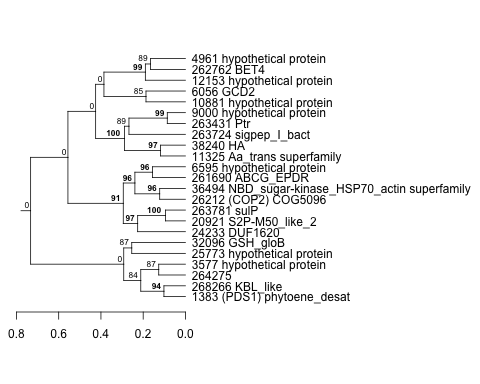
| Thaps_hclust_0277 |
 |
 |
0.00036 |
6.6 |
7.6 |
diel_light_vs_dark | 0.000485 | 0.973 |
| Thaps_hclust_0277 |
|
|
0.00036 |
6.6 |
7.6 |
lowFe_KTKB_Day5 | 0.001320 | 0.871 |
| Title | Cluster Plot | Dendrogram | e-value | e-value | e-value | Condition | Condition FDR | Condition Difference |
|---|---|---|---|---|---|---|---|---|
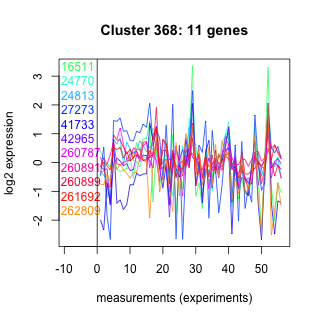
| Thaps_hclust_0368 |
 |
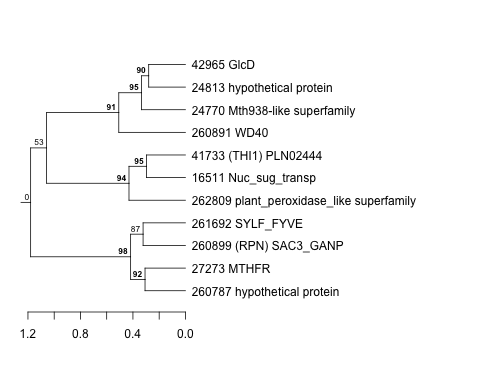 |
0.0078 |
2.5 |
3.1 |
co2_elevated_stat_arrays | 0.000658 | 0.971 |
| Title | Cluster Plot | Dendrogram | e-value | e-value | e-value | Condition | Condition FDR | Condition Difference |
|---|---|---|---|---|---|---|---|---|
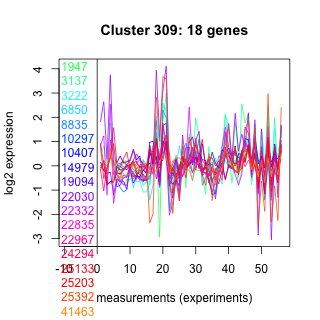
| Thaps_hclust_0309 |
 |
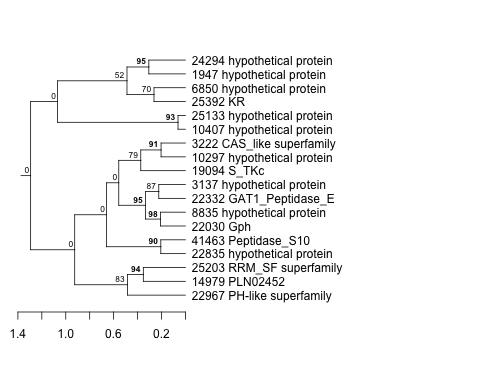 |
0.0000055 |
0.015 |
1.1 |
BaP | 0.000370 | 0.971 |
| Thaps_hclust_0309 |
|
|
0.0000055 |
0.015 |
1.1 |
lowSi_TMEVA | 0.046100 | 0.843 |
| Title | Cluster Plot | Dendrogram | e-value | e-value | e-value | Condition | Condition FDR | Condition Difference |
|---|---|---|---|---|---|---|---|---|
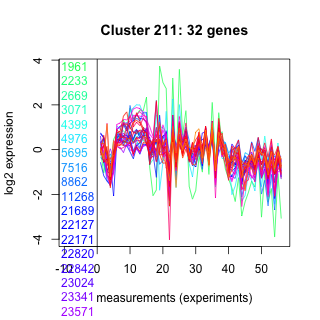
| Thaps_hclust_0211 |
 |
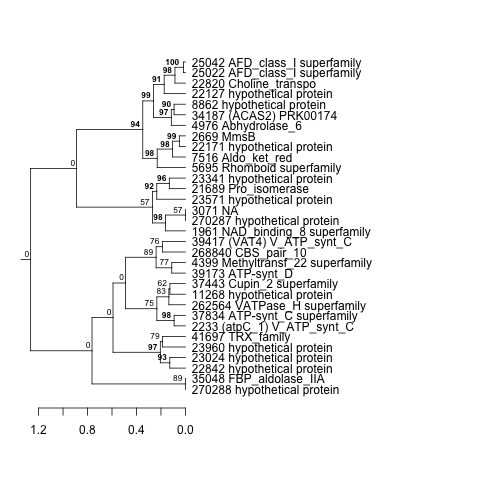 |
0.000000055 |
0.00014 |
0.026 |
diel_light_vs_dark | 0.000485 | 0.967 |
| Title | Cluster Plot | Dendrogram | e-value | e-value | e-value | Condition | Condition FDR | Condition Difference |
|---|---|---|---|---|---|---|---|---|
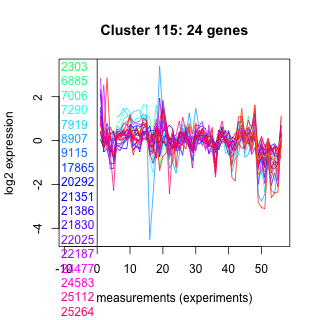
| Thaps_hclust_0115 |
 |
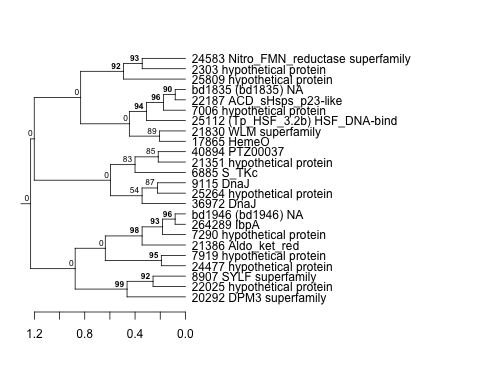 |
0.00037 |
0.044 |
0.46 |
highpH_TMEVA | 0.000725 | 0.966 |
| Thaps_hclust_0115 |
|
|
0.00037 |
0.044 |
0.46 |
highlight_arrays | 0.000442 | 0.848 |
| Title | Cluster Plot | Dendrogram | e-value | e-value | e-value | Condition | Condition FDR | Condition Difference |
|---|---|---|---|---|---|---|---|---|
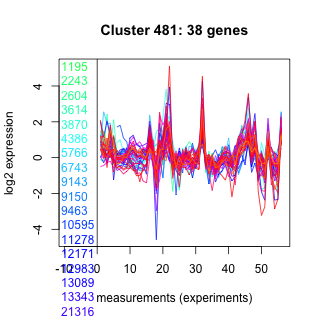
| Thaps_hclust_0481 |
 |
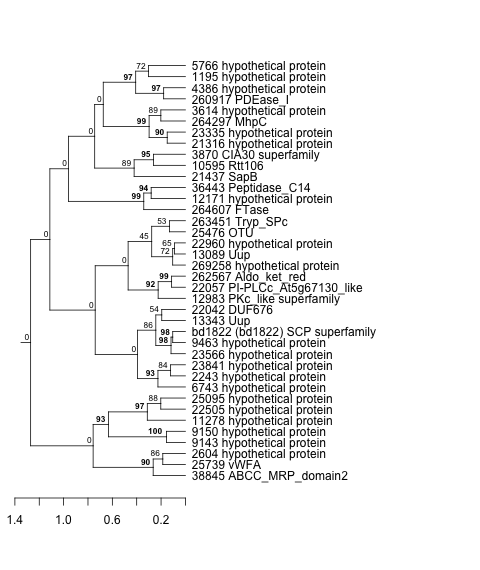 |
0.000000069 |
0.00000053 |
0.000012 |
lowFe_KTKB_Day3 | 0.000862 | 0.965 |
| Thaps_hclust_0481 |
|
|
0.000000069 |
0.00000053 |
0.000012 |
co2_elevated_stat_arrays | 0.000658 | 0.953 |
| Title | Cluster Plot | Dendrogram | e-value | e-value | e-value | Condition | Condition FDR | Condition Difference |
|---|---|---|---|---|---|---|---|---|
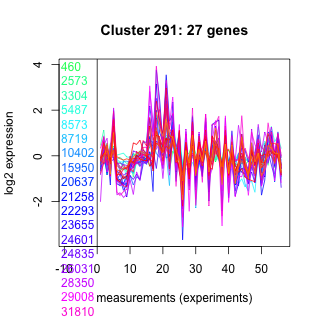
| Thaps_hclust_0291 |
 |
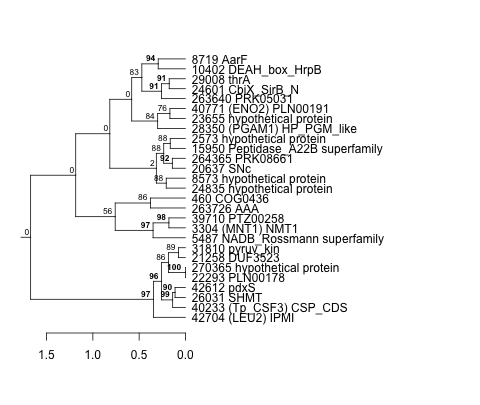 |
0.000000049 |
0.000056 |
0.0000035 |
BaP | 0.000370 | 0.963 |
| Thaps_hclust_0291 |
|
|
0.000000049 |
0.000056 |
0.0000035 |
lowtemp_TMEVA | 0.000735 | 0.954 |
| Title | Cluster Plot | Dendrogram | e-value | e-value | e-value | Condition | Condition FDR | Condition Difference |
|---|---|---|---|---|---|---|---|---|
| Thaps_hclust_0064 |
 |
 |
0.000000012 |
0.00000073 |
0.0000002 |
diel_exponential_vs_stationary | 0.000602 | 0.962 |
| Title | Cluster Plot | Dendrogram | e-value | e-value | e-value | Condition | Condition FDR | Condition Difference |
|---|---|---|---|---|---|---|---|---|
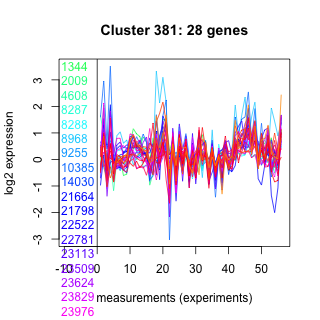
| Thaps_hclust_0381 |
 |
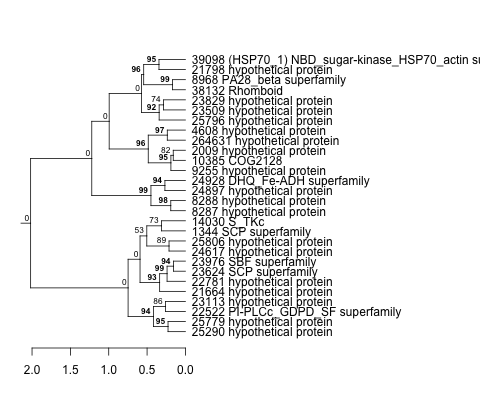 |
0.0001 |
0.0035 |
0.061 |
lowFe_TMEVA | 0.001040 | 0.952 |
| Title | Cluster Plot | Dendrogram | e-value | e-value | e-value | Condition | Condition FDR | Condition Difference |
|---|---|---|---|---|---|---|---|---|
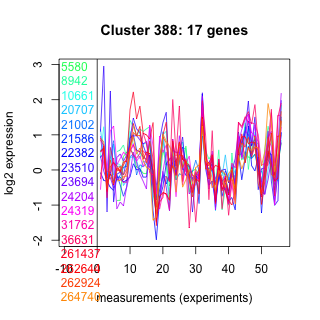
| Thaps_hclust_0388 |
 |
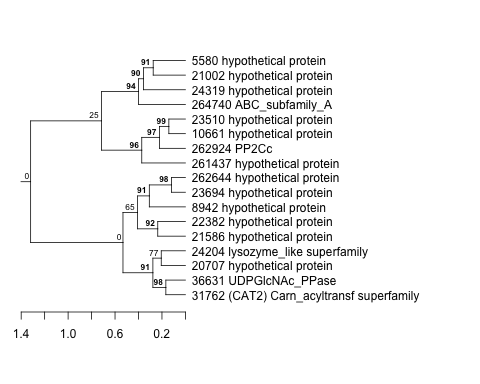 |
0.0000000024 |
23 |
380 |
co2_elevated_stat_arrays | 0.000658 | 0.952 |
| Title | Cluster Plot | Dendrogram | e-value | e-value | e-value | Condition | Condition FDR | Condition Difference |
|---|---|---|---|---|---|---|---|---|
| Thaps_hclust_0015 |
 |
|
2.5e-25 |
7.4e-21 |
0.0000000011 |
lowFe_KTKB_Day3 | 0.000862 | 0.949 |
| Title | Cluster Plot | Dendrogram | e-value | e-value | e-value | Condition | Condition FDR | Condition Difference |
|---|---|---|---|---|---|---|---|---|
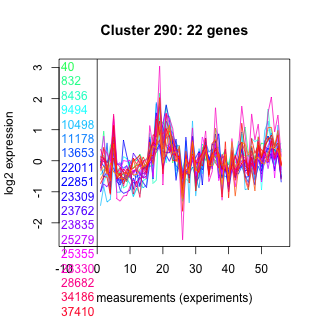
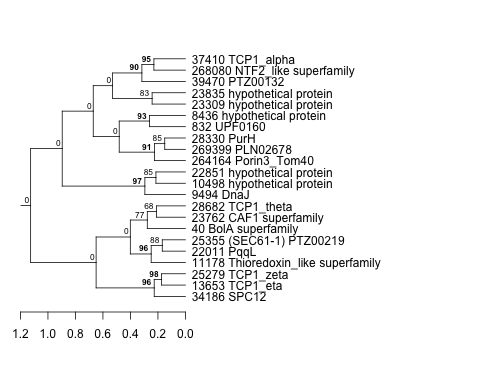
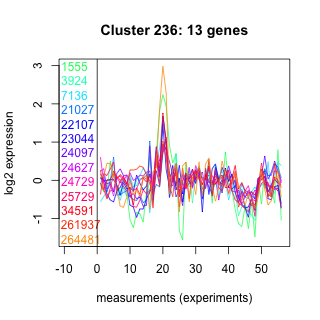
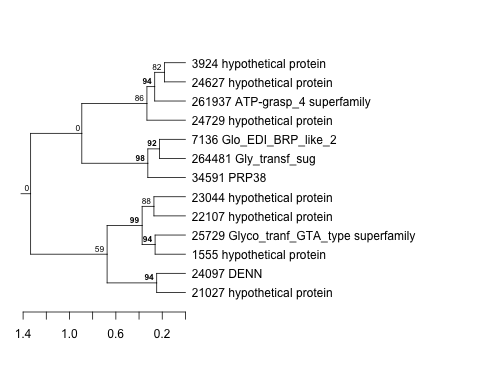
| Thaps_hclust_0331 |
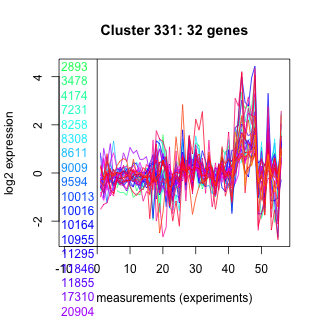 |
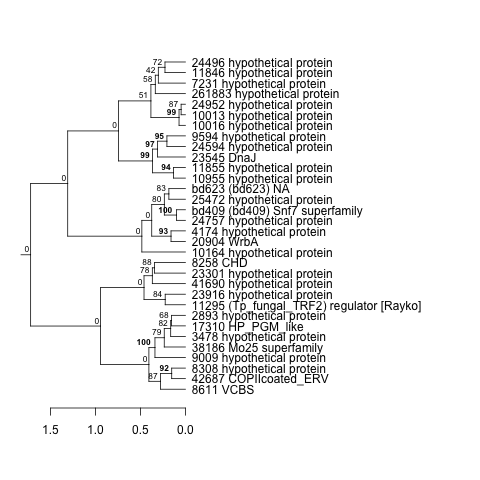 |
0.000000000011 |
20 |
1600 |
co2_elevated_stat_arrays | 0.000658 | 0.948 |
| Title | Cluster Plot | Dendrogram | e-value | e-value | e-value | Condition | Condition FDR | Condition Difference |
|---|---|---|---|---|---|---|---|---|
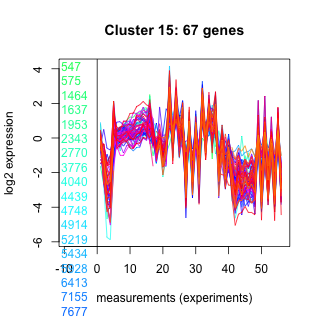
| Thaps_hclust_0122 |
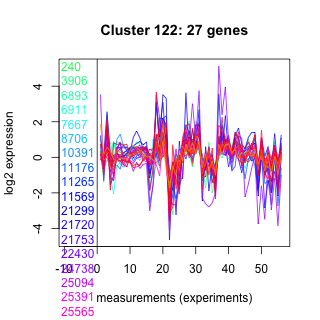 |
 |
0.0000037 |
0.061 |
0.0018 |
lowN_TMEVA | 0.001190 | 0.947 |
| Title | Cluster Plot | Dendrogram | e-value | e-value | e-value | Condition | Condition FDR | Condition Difference |
|---|---|---|---|---|---|---|---|---|
| Thaps_hclust_0055 |
 |
 |
0.000000038 |
0.0000074 |
0.1 |
lowtemp_TMEVA | 0.000735 | 0.947 |
| Title | Cluster Plot | Dendrogram | e-value | e-value | e-value | Condition | Condition FDR | Condition Difference |
|---|---|---|---|---|---|---|---|---|
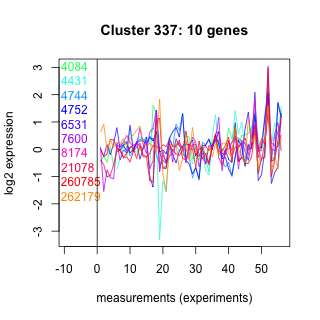
| Thaps_hclust_0337 |
 |
 |
3.5 |
3 |
280 |
co2_elevated_stat_arrays | 0.001700 | 0.946 |
| Title | Cluster Plot | Dendrogram | e-value | e-value | e-value | Condition | Condition FDR | Condition Difference |
|---|---|---|---|---|---|---|---|---|
| Thaps_hclust_0081 |
 |
 |
0.000000001 |
0.000000000027 |
0.28 |
exponential_vs_stationary_24light | 0.000581 | 0.942 |
| Title | Cluster Plot | Dendrogram | e-value | e-value | e-value | Condition | Condition FDR | Condition Difference |
|---|---|---|---|---|---|---|---|---|
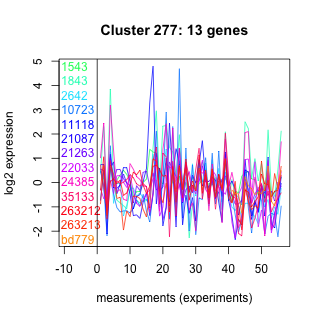
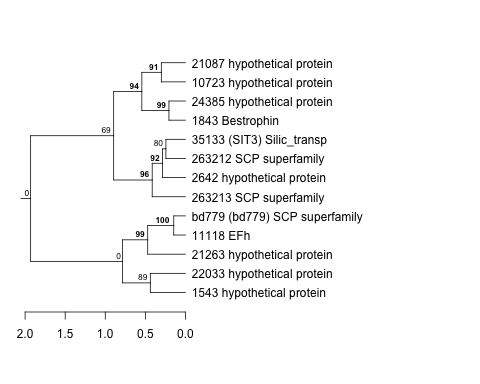
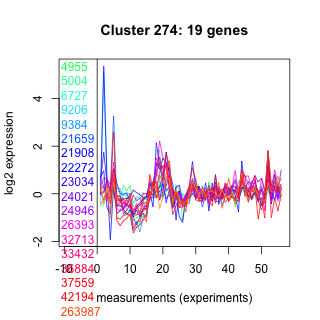
| Thaps_hclust_0274 |
 |
 |
0.0000064 |
0.048 |
6.7 |
lowFe_TMEVA | 0.001040 | 0.942 |
| Thaps_hclust_0274 |
|
|
0.0000064 |
0.048 |
6.7 |
lowtemp_TMEVA | 0.002080 | 0.914 |
| Title | Cluster Plot | Dendrogram | e-value | e-value | e-value | Condition | Condition FDR | Condition Difference |
|---|---|---|---|---|---|---|---|---|
| Thaps_hclust_0117 |
 |
 |
0.0000000000002 |
0.000000021 |
0.00000045 |
lowFe_TMEVA | 0.001040 | 0.941 |
| Thaps_hclust_0117 |
|
|
0.0000000000002 |
0.000000021 |
0.00000045 |
co2_elevated_stat_arrays | 0.000658 | 0.91 |
| Title | Cluster Plot | Dendrogram | e-value | e-value | e-value | Condition | Condition FDR | Condition Difference |
|---|---|---|---|---|---|---|---|---|
| Thaps_hclust_0023 |
 |
 |
0.000000000039 |
0.0000072 |
0.002 |
diel_exponential_vs_stationary | 0.000602 | 0.941 |
| Title | Cluster Plot | Dendrogram | e-value | e-value | e-value | Condition | Condition FDR | Condition Difference |
|---|---|---|---|---|---|---|---|---|
| Thaps_hclust_0027 |
 |
 |
0.0000000084 |
0.0086 |
0.069 |
exponential_vs_stationary_24light | 0.000581 | 0.935 |
| Title | Cluster Plot | Dendrogram | e-value | e-value | e-value | Condition | Condition FDR | Condition Difference |
|---|---|---|---|---|---|---|---|---|
| Thaps_hclust_0227 |
 |
 |
1.2e-22 |
0.0000000098 |
0.0018 |
lowtemp_TMEVA | 0.000735 | 0.934 |
| Title | Cluster Plot | Dendrogram | e-value | e-value | e-value | Condition | Condition FDR | Condition Difference |
|---|---|---|---|---|---|---|---|---|
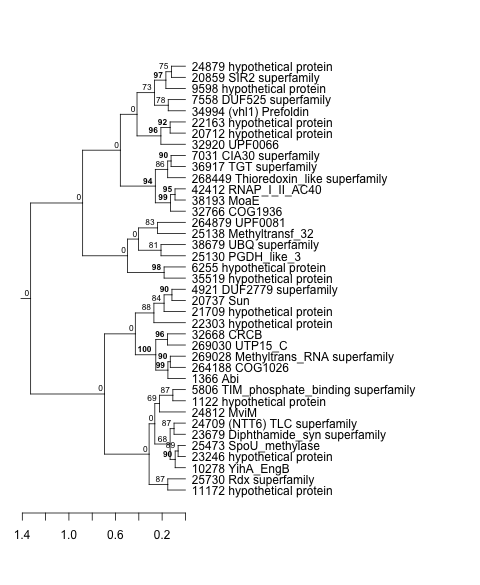
| Thaps_hclust_0377 |
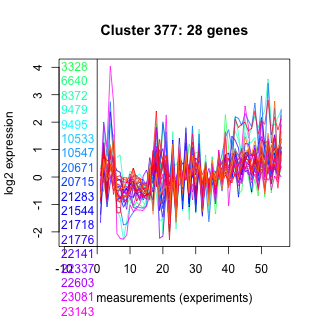 |
 |
0.00016 |
0.034 |
0.95 |
lowSi_TMEVA | 0.001350 | 0.932 |
| Thaps_hclust_0377 |
|
|
0.00016 |
0.034 |
0.95 |
diel_light_vs_dark | 0.000485 | 0.898 |
| Title | Cluster Plot | Dendrogram | e-value | e-value | e-value | Condition | Condition FDR | Condition Difference |
|---|---|---|---|---|---|---|---|---|
| Thaps_hclust_0308 |
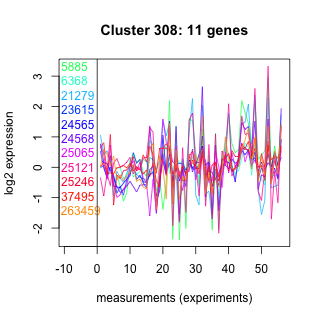 |
 |
0.37 |
17 |
1.6 |
co2_elevated_stat_arrays | 0.000658 | 0.927 |
| Title | Cluster Plot | Dendrogram | e-value | e-value | e-value | Condition | Condition FDR | Condition Difference |
|---|---|---|---|---|---|---|---|---|
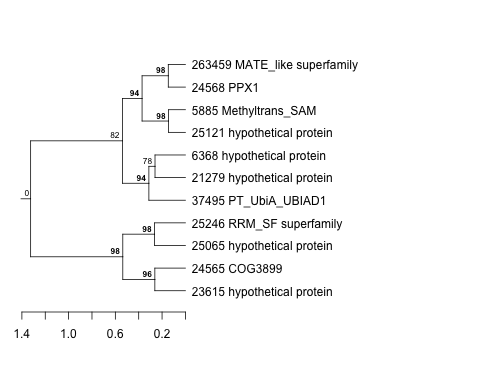
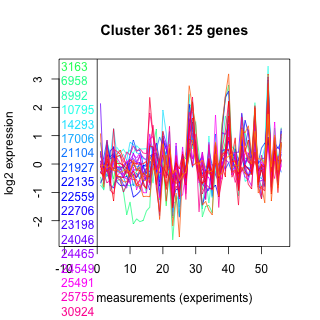
| Thaps_hclust_0361 |
 |
 |
0.00000000081 |
0.14 |
2.1 |
co2_elevated_stat_arrays | 0.000658 | 0.924 |
| Title | Cluster Plot | Dendrogram | e-value | e-value | e-value | Condition | Condition FDR | Condition Difference |
|---|---|---|---|---|---|---|---|---|
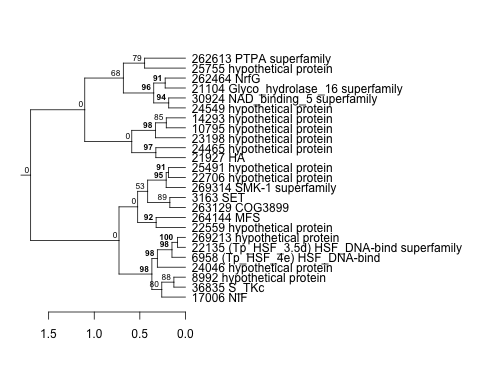
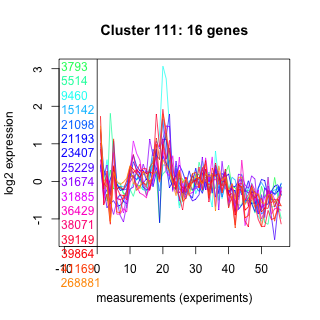
| Thaps_hclust_0111 |
 |
 |
0.00032 |
0.0074 |
0.8 |
highpH_TMEVA | 0.000725 | 0.921 |
| Title | Cluster Plot | Dendrogram | e-value | e-value | e-value | Condition | Condition FDR | Condition Difference |
|---|---|---|---|---|---|---|---|---|
| Thaps_hclust_0228 |
 |
 |
0.00000000000028 |
0.0027 |
0.016 |
co2_elevated_stat_arrays | 0.000658 | 0.92 |
| Title | Cluster Plot | Dendrogram | e-value | e-value | e-value | Condition | Condition FDR | Condition Difference |
|---|---|---|---|---|---|---|---|---|
| Thaps_hclust_0099 |
 |
 |
0.0000000000000032 |
0.000000000000013 |
0.000000000000025 |
exponential_vs_stationary_24highlight | 0.000526 | 0.919 |
| Title | Cluster Plot | Dendrogram | e-value | e-value | e-value | Condition | Condition FDR | Condition Difference |
|---|---|---|---|---|---|---|---|---|
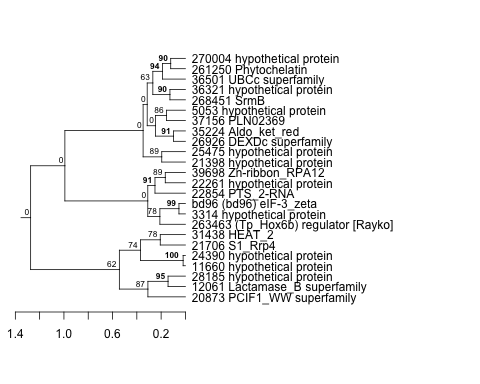
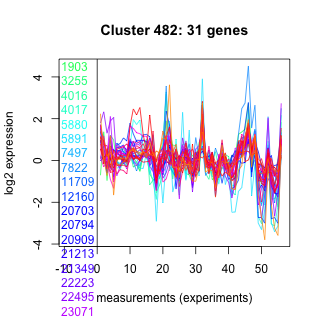
| Thaps_hclust_0482 |
 |
 |
0.29 |
0.69 |
2.1 |
highpH_TMEVA | 0.000725 | 0.919 |
| Title | Cluster Plot | Dendrogram | e-value | e-value | e-value | Condition | Condition FDR | Condition Difference |
|---|---|---|---|---|---|---|---|---|
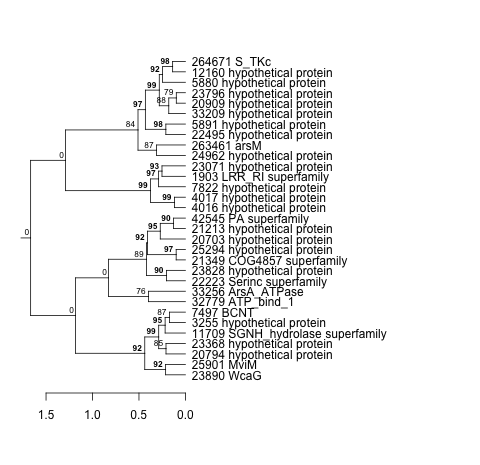
| Thaps_hclust_0209 |
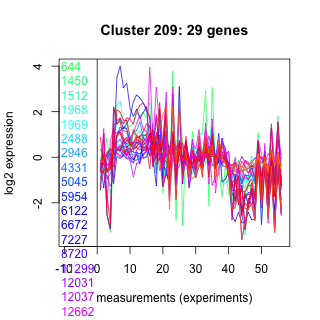 |
 |
1.2e-16 |
0.00011 |
0.000027 |
lowFe_KTKB_Day3 | 0.000862 | 0.919 |
| Title | Cluster Plot | Dendrogram | e-value | e-value | e-value | Condition | Condition FDR | Condition Difference |
|---|---|---|---|---|---|---|---|---|
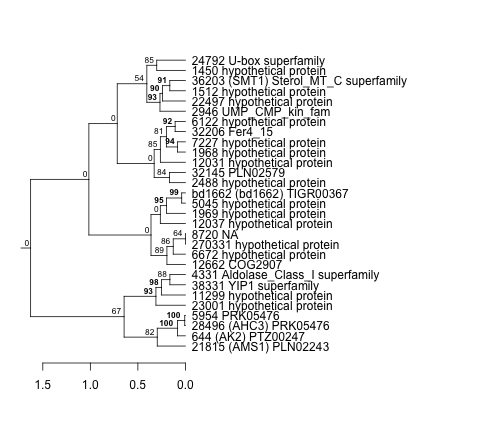
| Thaps_hclust_0217 |
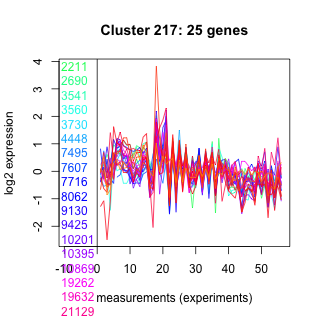 |
 |
0.00000028 |
0.95 |
9.7 |
BaP | 0.000370 | 0.918 |
| Title | Cluster Plot | Dendrogram | e-value | e-value | e-value | Condition | Condition FDR | Condition Difference |
|---|---|---|---|---|---|---|---|---|
| Thaps_hclust_0018 |
 |
 |
0.065 |
0.38 |
0.16 |
diel_exponential_vs_stationary | 0.000602 | 0.915 |
| Title | Cluster Plot | Dendrogram | e-value | e-value | e-value | Condition | Condition FDR | Condition Difference |
|---|---|---|---|---|---|---|---|---|
| Thaps_hclust_0229 |
 |
 |
9.9e-18 |
0.000000000000034 |
0.0000002 |
co2_elevated_stat_arrays | 0.000658 | 0.914 |
| Title | Cluster Plot | Dendrogram | e-value | e-value | e-value | Condition | Condition FDR | Condition Difference |
|---|---|---|---|---|---|---|---|---|
| Thaps_hclust_0208 |
 |
|
1.2e-20 |
0.0000000000000057 |
0.0000000099 |
exponential_vs_stationary_24light | 0.000581 | 0.911 |
| Title | Cluster Plot | Dendrogram | e-value | e-value | e-value | Condition | Condition FDR | Condition Difference |
|---|---|---|---|---|---|---|---|---|
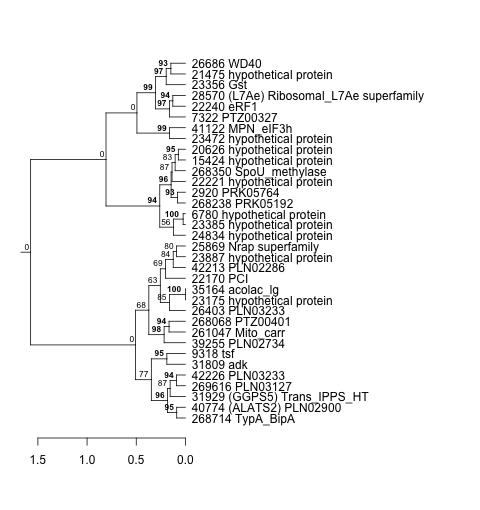
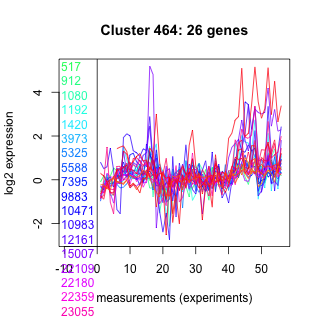
| Thaps_hclust_0464 |
 |
 |
0.0002 |
14 |
31 |
lowFe_KTKB_Day3 | 0.000862 | 0.909 |
| Title | Cluster Plot | Dendrogram | e-value | e-value | e-value | Condition | Condition FDR | Condition Difference |
|---|---|---|---|---|---|---|---|---|
| Thaps_hclust_0085 |
 |
 |
0.000012 |
0.0024 |
0.37 |
diel_light_vs_dark | 0.000485 | 0.908 |
| Title | Cluster Plot | Dendrogram | e-value | e-value | e-value | Condition | Condition FDR | Condition Difference |
|---|---|---|---|---|---|---|---|---|
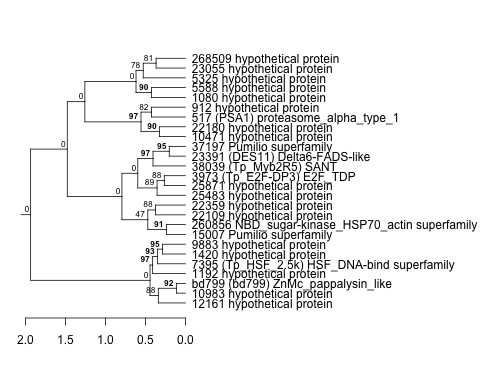
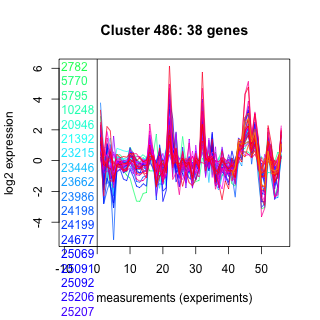
| Thaps_hclust_0486 |
 |
 |
0.000000043 |
0.044 |
0.047 |
diel_exponential_vs_stationary | 0.000602 | 0.908 |
| Title | Cluster Plot | Dendrogram | e-value | e-value | e-value | Condition | Condition FDR | Condition Difference |
|---|---|---|---|---|---|---|---|---|
| Thaps_hclust_0084 |
 |
 |
0.0000000000035 |
0.00000025 |
0.12 |
diel_light_vs_dark | 0.000485 | 0.903 |
| Title | Cluster Plot | Dendrogram | e-value | e-value | e-value | Condition | Condition FDR | Condition Difference |
|---|---|---|---|---|---|---|---|---|
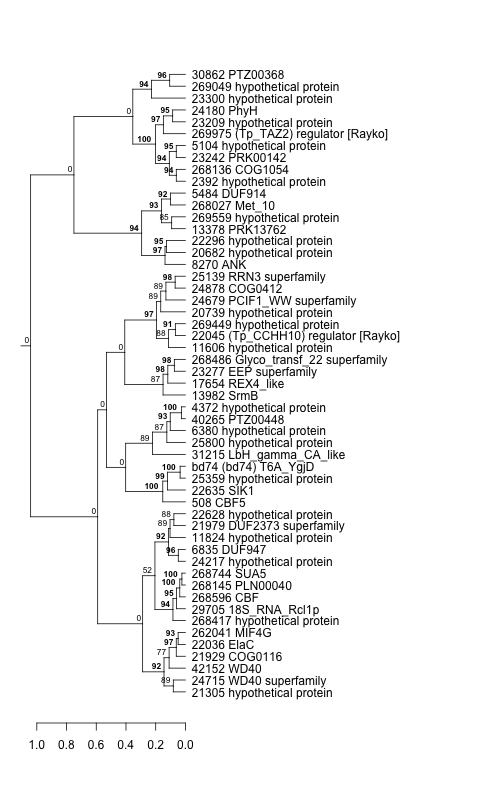
| Thaps_hclust_0223 |
 |
 |
1.70006e-41 |
0.000000000000099 |
0.0011 |
lowtemp_TMEVA | 0.000735 | 0.902 |
| Thaps_hclust_0223 |
|
|
1.70006e-41 |
0.000000000000099 |
0.0011 |
co2_elevated_stat_arrays | 0.000658 | 0.847 |
| Title | Cluster Plot | Dendrogram | e-value | e-value | e-value | Condition | Condition FDR | Condition Difference |
|---|---|---|---|---|---|---|---|---|
| Thaps_hclust_0220 |
 |
|
|
2.4e-19 |
3.2e-19 |
lowtemp_TMEVA | 0.000735 | 0.902 |
| Thaps_hclust_0220 |
|
|
|
2.4e-19 |
3.2e-19 |
lowN_TMEVA | 0.001190 | 0.851 |
| Title | Cluster Plot | Dendrogram | e-value | e-value | e-value | Condition | Condition FDR | Condition Difference |
|---|---|---|---|---|---|---|---|---|
| Thaps_hclust_0042 |
 |
 |
0.26 |
5.9 |
0.46 |
co2_elevated_stat_arrays | 0.000658 | 0.898 |
| Title | Cluster Plot | Dendrogram | e-value | e-value | e-value | Condition | Condition FDR | Condition Difference |
|---|---|---|---|---|---|---|---|---|
| Thaps_hclust_0061 |
 |
 |
0.000000062 |
0.00063 |
0.032 |
exponential_vs_stationary_24highlight | 0.000526 | 0.898 |
| Title | Cluster Plot | Dendrogram | e-value | e-value | e-value | Condition | Condition FDR | Condition Difference |
|---|---|---|---|---|---|---|---|---|
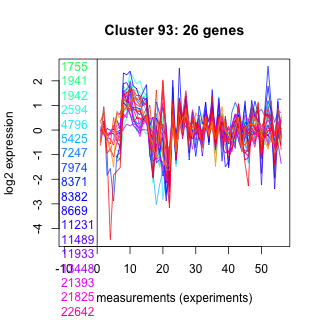
| Thaps_hclust_0093 |
 |
 |
0.0000082 |
0.022 |
0.0012 |
diel_light_vs_dark | 0.000485 | 0.897 |
| Title | Cluster Plot | Dendrogram | e-value | e-value | e-value | Condition | Condition FDR | Condition Difference |
|---|---|---|---|---|---|---|---|---|
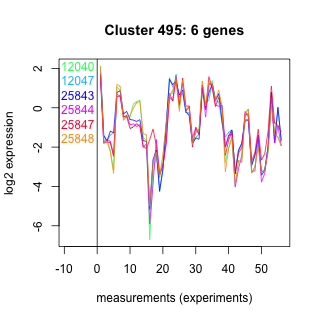
| Thaps_hclust_0495 |
 |
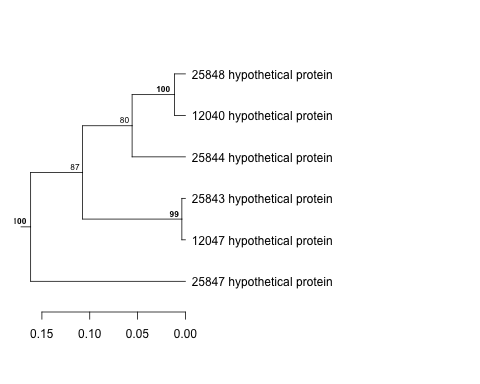 |
0.0000000031 |
0.00000049 |
0.0000038 |
exponential_vs_stationary_24light | 0.095000 | 0.895 |
| Title | Cluster Plot | Dendrogram | e-value | e-value | e-value | Condition | Condition FDR | Condition Difference |
|---|---|---|---|---|---|---|---|---|
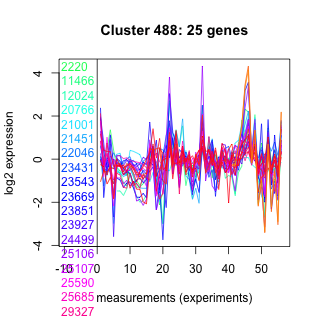
| Thaps_hclust_0488 |
 |
 |
0.15 |
0.012 |
0.2 |
highlight_arrays | 0.000442 | 0.893 |
| Title | Cluster Plot | Dendrogram | e-value | e-value | e-value | Condition | Condition FDR | Condition Difference |
|---|---|---|---|---|---|---|---|---|
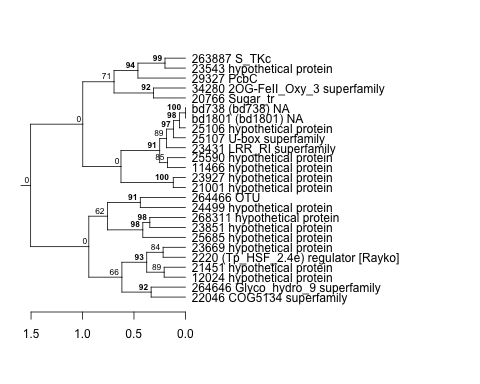
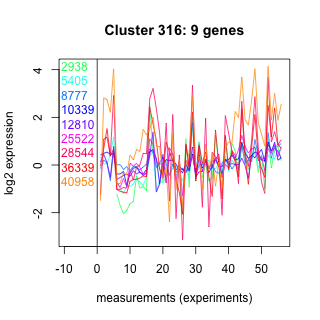
| Thaps_hclust_0316 |
 |
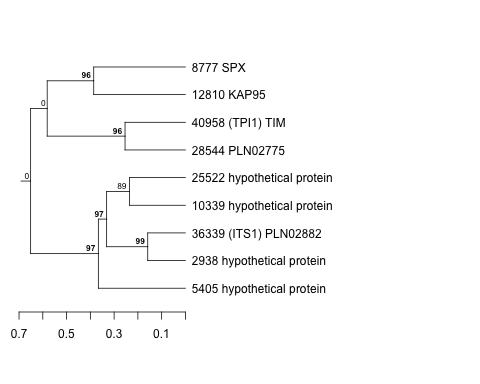 |
0.14 |
2.2 |
4.4 |
lowN_TMEVA | 0.057000 | 0.889 |
| Thaps_hclust_0316 |
|
|
0.14 |
2.2 |
4.4 |
co2_elevated_stat_arrays | 0.002130 | 0.872 |
| Title | Cluster Plot | Dendrogram | e-value | e-value | e-value | Condition | Condition FDR | Condition Difference |
|---|---|---|---|---|---|---|---|---|
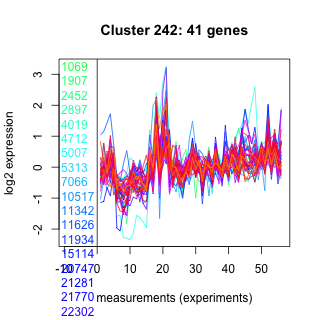
| Thaps_hclust_0242 |
 |
 |
3e-20 |
0.0000000000034 |
0.0085 |
BaP | 0.000370 | 0.886 |
| Title | Cluster Plot | Dendrogram | e-value | e-value | e-value | Condition | Condition FDR | Condition Difference |
|---|---|---|---|---|---|---|---|---|
| Thaps_hclust_0212 |
 |
 |
2.5e-17 |
0.000019 |
0.027 |
diel_light_vs_dark | 0.000485 | 0.886 |
| Title | Cluster Plot | Dendrogram | e-value | e-value | e-value | Condition | Condition FDR | Condition Difference |
|---|---|---|---|---|---|---|---|---|
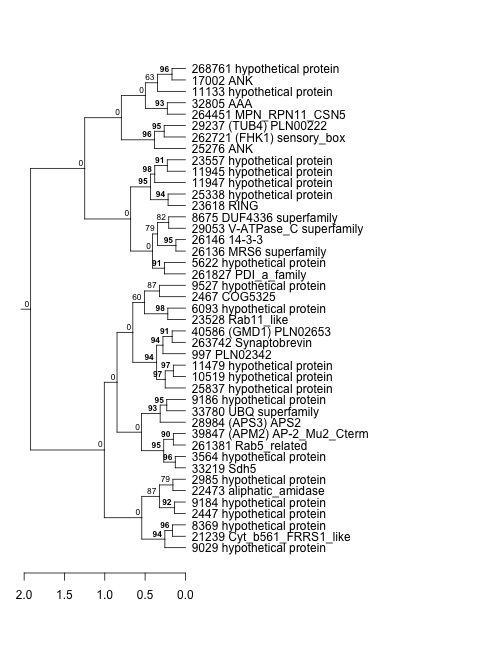
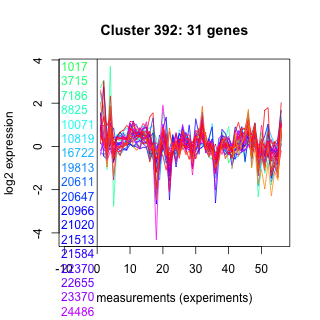
| Thaps_hclust_0392 |
 |
 |
0.00055 |
0.0027 |
0.19 |
highpH_TMEVA | 0.000725 | 0.886 |
| Title | Cluster Plot | Dendrogram | e-value | e-value | e-value | Condition | Condition FDR | Condition Difference |
|---|---|---|---|---|---|---|---|---|
| Thaps_hclust_0034 |
 |
 |
0.000015 |
0.000083 |
0.63 |
lowFe_KTKB_Day3 | 0.000862 | 0.884 |
| Title | Cluster Plot | Dendrogram | e-value | e-value | e-value | Condition | Condition FDR | Condition Difference |
|---|---|---|---|---|---|---|---|---|
| Thaps_hclust_0014 |
 |
 |
Not available | Not available | Not available | lowFe_KTKB_Day5 | 0.001320 | 0.884 |
| Thaps_hclust_0014 |
|
|
Not available | Not available | Not available | diel_exponential_vs_stationary | 0.000602 | 0.865 |
| Title | Cluster Plot | Dendrogram | e-value | e-value | e-value | Condition | Condition FDR | Condition Difference |
|---|---|---|---|---|---|---|---|---|
| Thaps_hclust_0048 |
 |
 |
4.8e-17 |
0.000000018 |
0.0000097 |
lowtemp_TMEVA | 0.000735 | 0.883 |
| Thaps_hclust_0048 |
|
|
4.8e-17 |
0.000000018 |
0.0000097 |
lowFe_KTKB_Day5 | 0.001320 | 0.84 |
| Title | Cluster Plot | Dendrogram | e-value | e-value | e-value | Condition | Condition FDR | Condition Difference |
|---|---|---|---|---|---|---|---|---|
| Thaps_hclust_0216 |
 |
 |
0.0000076 |
0.019 |
0.0036 |
diel_light_vs_dark | 0.000485 | 0.882 |
| Title | Cluster Plot | Dendrogram | e-value | e-value | e-value | Condition | Condition FDR | Condition Difference |
|---|---|---|---|---|---|---|---|---|
| Thaps_hclust_0067 |
 |
 |
0.0036 |
0.86 |
0.11 |
exponential_vs_stationary_24light | 0.009720 | 0.882 |
| Title | Cluster Plot | Dendrogram | e-value | e-value | e-value | Condition | Condition FDR | Condition Difference |
|---|---|---|---|---|---|---|---|---|
| Thaps_hclust_0276 |
 |
 |
0.063 |
39 |
53 |
diel_exponential_vs_stationary | 0.000602 | 0.877 |
| Title | Cluster Plot | Dendrogram | e-value | e-value | e-value | Condition | Condition FDR | Condition Difference |
|---|---|---|---|---|---|---|---|---|
| Thaps_hclust_0241 |
 |
 |
0.0000000022 |
0.0000017 |
0.68 |
lowtemp_TMEVA | 0.000735 | 0.876 |
| Title | Cluster Plot | Dendrogram | e-value | e-value | e-value | Condition | Condition FDR | Condition Difference |
|---|---|---|---|---|---|---|---|---|
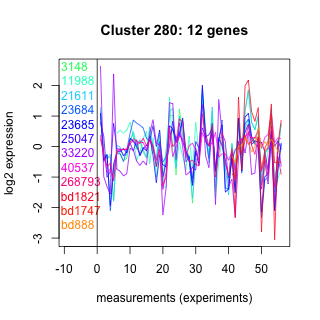
| Thaps_hclust_0280 |
 |
 |
0.75 |
0.64 |
81 |
exponential_vs_stationary_24light | 0.022100 | 0.876 |
| Title | Cluster Plot | Dendrogram | e-value | e-value | e-value | Condition | Condition FDR | Condition Difference |
|---|---|---|---|---|---|---|---|---|
| Thaps_hclust_0343 |
 |
 |
9.7e-16 |
0.000000023 |
0.0000000024 |
highlight_arrays | 0.000442 | 0.875 |
| Title | Cluster Plot | Dendrogram | e-value | e-value | e-value | Condition | Condition FDR | Condition Difference |
|---|---|---|---|---|---|---|---|---|
| Thaps_hclust_0079 |
 |
 |
0.00048 |
0.000048 |
0.27 |
diel_light_vs_dark | 0.000485 | 0.873 |
| Title | Cluster Plot | Dendrogram | e-value | e-value | e-value | Condition | Condition FDR | Condition Difference |
|---|---|---|---|---|---|---|---|---|
| Thaps_hclust_0367 |
 |
 |
0.027 |
0.079 |
0.86 |
BaP | 0.000370 | 0.871 |
| Thaps_hclust_0367 |
|
|
0.027 |
0.079 |
0.86 |
diel_light_vs_dark | 0.000485 | 0.845 |
| Title | Cluster Plot | Dendrogram | e-value | e-value | e-value | Condition | Condition FDR | Condition Difference |
|---|---|---|---|---|---|---|---|---|
| Thaps_hclust_0304 |
 |
 |
0.16 |
1.3 |
16 |
highlight_arrays | 0.000442 | 0.864 |
| Title | Cluster Plot | Dendrogram | e-value | e-value | e-value | Condition | Condition FDR | Condition Difference |
|---|---|---|---|---|---|---|---|---|
| Thaps_hclust_0290 |
 |
 |
3e-16 |
0.014 |
0.072 |
BaP | 0.000370 | 0.863 |
| Title | Cluster Plot | Dendrogram | e-value | e-value | e-value | Condition | Condition FDR | Condition Difference |
|---|---|---|---|---|---|---|---|---|
| Thaps_hclust_0001 |
 |
 |
0.0033 |
0.052 |
2 |
lowFe_KTKB_Day3 | 0.000862 | 0.863 |
| Title | Cluster Plot | Dendrogram | e-value | e-value | e-value | Condition | Condition FDR | Condition Difference |
|---|---|---|---|---|---|---|---|---|
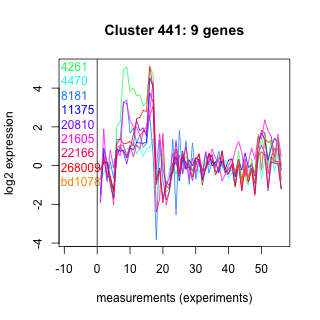
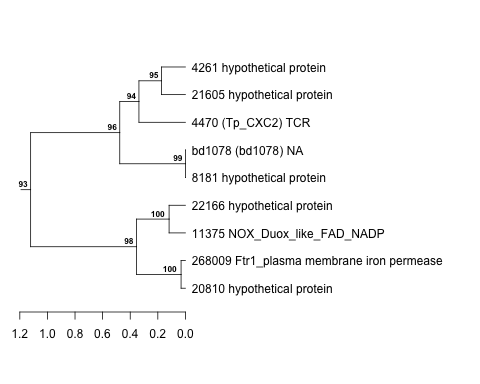
| Thaps_hclust_0441 |
 |
 |
0.00081 |
0.001 |
0.0015 |
exponential_vs_stationary_24light | 0.053300 | 0.861 |
| Title | Cluster Plot | Dendrogram | e-value | e-value | e-value | Condition | Condition FDR | Condition Difference |
|---|---|---|---|---|---|---|---|---|
| Thaps_hclust_0250 |
 |
 |
0.38 |
88 |
290 |
lowSi_TMEVA | 0.101000 | 0.861 |
| Title | Cluster Plot | Dendrogram | e-value | e-value | e-value | Condition | Condition FDR | Condition Difference |
|---|---|---|---|---|---|---|---|---|
| Thaps_hclust_0049 |
 |
 |
0.00054 |
0.0063 |
0.03 |
exponential_vs_stationary_24light | 0.000581 | 0.86 |
| Title | Cluster Plot | Dendrogram | e-value | e-value | e-value | Condition | Condition FDR | Condition Difference |
|---|---|---|---|---|---|---|---|---|
| Thaps_hclust_0072 |
 |
 |
1.2e-22 |
1.1e-16 |
0.000000000000011 |
lowtemp_TMEVA | 0.044600 | 0.856 |
| Title | Cluster Plot | Dendrogram | e-value | e-value | e-value | Condition | Condition FDR | Condition Difference |
|---|---|---|---|---|---|---|---|---|
| Thaps_hclust_0234 |
 |
 |
0.036 |
0.063 |
0.24 |
co2_elevated_stat_arrays | 0.000658 | 0.855 |
| Title | Cluster Plot | Dendrogram | e-value | e-value | e-value | Condition | Condition FDR | Condition Difference |
|---|---|---|---|---|---|---|---|---|
| Thaps_hclust_0271 |
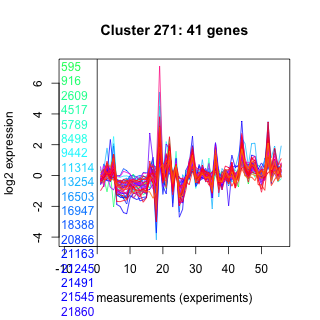 |
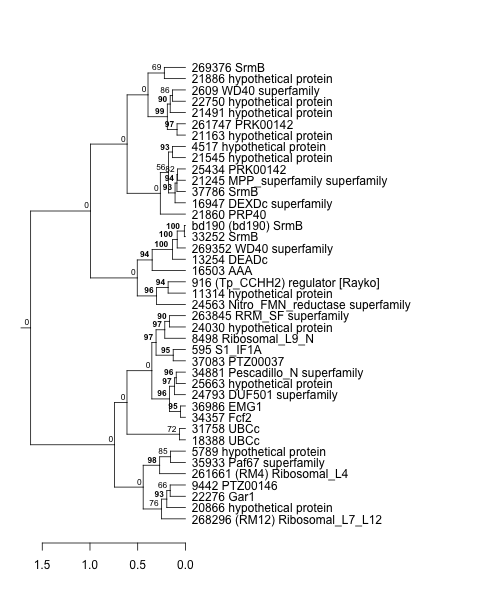 |
Not available | Not available | Not available | co2_elevated_stat_arrays | 0.000658 | 0.854 |
| Title | Cluster Plot | Dendrogram | e-value | e-value | e-value | Condition | Condition FDR | Condition Difference |
|---|---|---|---|---|---|---|---|---|
| Thaps_hclust_0424 |
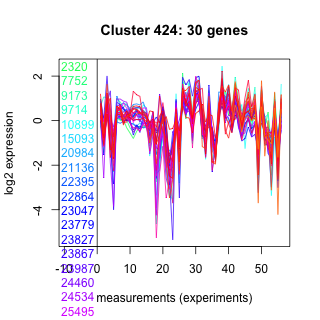 |
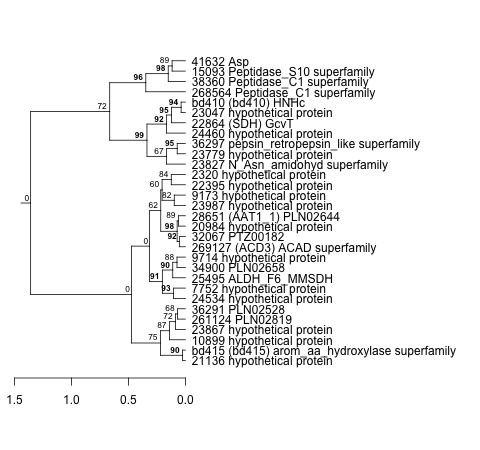 |
0.012 |
0.74 |
0.26 |
lowN_TMEVA | 0.001190 | 0.853 |
| Title | Cluster Plot | Dendrogram | e-value | e-value | e-value | Condition | Condition FDR | Condition Difference |
|---|---|---|---|---|---|---|---|---|
| Thaps_hclust_0094 |
 |
 |
0.0000000025 |
0.000014 |
0.0000045 |
exponential_vs_stationary_24light | 0.000581 | 0.852 |
| Title | Cluster Plot | Dendrogram | e-value | e-value | e-value | Condition | Condition FDR | Condition Difference |
|---|---|---|---|---|---|---|---|---|
| Thaps_hclust_0063 |
 |
 |
9.8e-19 |
5.7e-17 |
8.2e-17 |
lowtemp_TMEVA | 0.001430 | 0.847 |
| Title | Cluster Plot | Dendrogram | e-value | e-value | e-value | Condition | Condition FDR | Condition Difference |
|---|---|---|---|---|---|---|---|---|
| Thaps_hclust_0303 |
 |
 |
0.00096 |
0.0021 |
0.0014 |
highlight_arrays | 0.000442 | 0.842 |
| Title | Cluster Plot | Dendrogram | e-value | e-value | e-value | Condition | Condition FDR | Condition Difference |
|---|---|---|---|---|---|---|---|---|
| Thaps_hclust_0019 |
 |
 |
0.0000001 |
0.00000017 |
0.000037 |
exponential_vs_stationary_24light | 0.002660 | 0.842 |
| Title | Cluster Plot | Dendrogram | e-value | e-value | e-value | Condition | Condition FDR | Condition Difference |
|---|---|---|---|---|---|---|---|---|
| Thaps_hclust_0236 |
 |
 |
0.0078 |
3.3 |
1.1 |
BaP | 0.001910 | 0.84 |
| Title | Cluster Plot | Dendrogram | e-value | e-value | e-value | Condition | Condition FDR | Condition Difference |
|---|---|---|---|---|---|---|---|---|
| Thaps_hclust_0498 |
 |
 |
1.3 |
1.8 |
1.8 |
highpH_TMEVA | 0.000725 | 0.839 |