Hierarchical Clusters
Displaying 301 - 400 of 7500
| Title | Cluster Plot | Dendrogram | e-value | e-value | e-value | Condition | Condition FDR | Condition Difference |
|---|---|---|---|---|---|---|---|---|
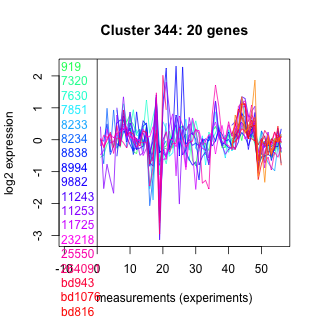
| Thaps_hclust_0344 |
 |
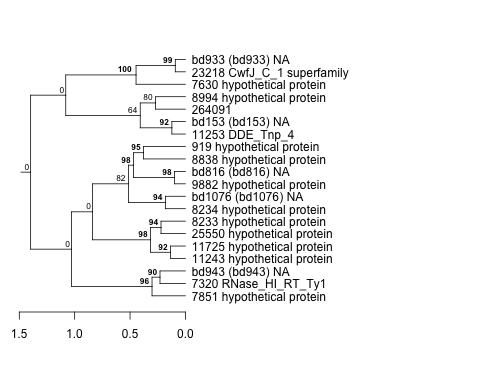 |
7.9 |
94 |
120 |
co2_elevated_expo_arrays | 0.107000 | 0.236 |
| Thaps_hclust_0344 |
|
|
7.9 |
94 |
120 |
lowFe_TMEVA | 0.092100 | -0.429 |
| Thaps_hclust_0344 |
|
|
7.9 |
94 |
120 |
exponential_vs_stationary_24light | 0.604000 | -0.189 |
| Thaps_hclust_0344 |
|
|
7.9 |
94 |
120 |
lowN_TMEVA | 0.761000 | 0.125 |
| Thaps_hclust_0344 |
|
|
7.9 |
94 |
120 |
diel_exponential_vs_stationary | 0.716000 | 0.0782 |
| Thaps_hclust_0344 |
|
|
7.9 |
94 |
120 |
lowSi_TMEVA | 0.854000 | -0.204 |
| Thaps_hclust_0344 |
|
|
7.9 |
94 |
120 |
highlight_arrays | 0.000442 | 0.607 |
| Thaps_hclust_0344 |
|
|
7.9 |
94 |
120 |
diel_light_vs_dark | 0.726000 | -0.0922 |
| Thaps_hclust_0344 |
|
|
7.9 |
94 |
120 |
lowFe_KTKB_Day3 | 0.000862 | -0.762 |
| Thaps_hclust_0344 |
|
|
7.9 |
94 |
120 |
lowFe_KTKB_Day5 | 0.008180 | -0.49 |
| Thaps_hclust_0344 |
|
|
7.9 |
94 |
120 |
BaP | 0.587000 | -0.132 |
| Thaps_hclust_0344 |
|
|
7.9 |
94 |
120 |
exponential_vs_stationary_24highlight | 0.633000 | -0.0581 |
| Thaps_hclust_0344 |
|
|
7.9 |
94 |
120 |
co2_elevated_stat_arrays | 0.338000 | 0.226 |
| Thaps_hclust_0344 |
|
|
7.9 |
94 |
120 |
lowtemp_TMEVA | 0.380000 | -0.228 |
| Thaps_hclust_0344 |
|
|
7.9 |
94 |
120 |
highpH_TMEVA | 0.609000 | -0.092 |
| Title | Cluster Plot | Dendrogram | e-value | e-value | e-value | Condition | Condition FDR | Condition Difference |
|---|---|---|---|---|---|---|---|---|
| Thaps_hclust_0494 |
 |
 |
6.7 |
15 |
60 |
diel_light_vs_dark | 0.000485 | -0.616 |
| Thaps_hclust_0494 |
|
|
6.7 |
15 |
60 |
lowFe_KTKB_Day3 | 0.133000 | -0.345 |
| Thaps_hclust_0494 |
|
|
6.7 |
15 |
60 |
lowFe_KTKB_Day5 | 0.146000 | -0.29 |
| Thaps_hclust_0494 |
|
|
6.7 |
15 |
60 |
BaP | 0.000370 | -1.55 |
| Thaps_hclust_0494 |
|
|
6.7 |
15 |
60 |
exponential_vs_stationary_24highlight | 0.109000 | -0.17 |
| Thaps_hclust_0494 |
|
|
6.7 |
15 |
60 |
co2_elevated_stat_arrays | 0.346000 | 0.222 |
| Thaps_hclust_0494 |
|
|
6.7 |
15 |
60 |
lowtemp_TMEVA | 0.000735 | -2.04 |
| Thaps_hclust_0494 |
|
|
6.7 |
15 |
60 |
highpH_TMEVA | 0.000725 | 0.57 |
| Thaps_hclust_0494 |
|
|
6.7 |
15 |
60 |
co2_elevated_expo_arrays | 0.068700 | -0.252 |
| Thaps_hclust_0494 |
|
|
6.7 |
15 |
60 |
lowFe_TMEVA | 0.001040 | -1.24 |
| Thaps_hclust_0494 |
|
|
6.7 |
15 |
60 |
exponential_vs_stationary_24light | 0.406000 | -0.278 |
| Thaps_hclust_0494 |
|
|
6.7 |
15 |
60 |
lowN_TMEVA | 0.842000 | 0.08 |
| Thaps_hclust_0494 |
|
|
6.7 |
15 |
60 |
diel_exponential_vs_stationary | 0.000602 | 1.04 |
| Thaps_hclust_0494 |
|
|
6.7 |
15 |
60 |
lowSi_TMEVA | 0.050000 | -0.762 |
| Thaps_hclust_0494 |
|
|
6.7 |
15 |
60 |
highlight_arrays | 0.001570 | 0.468 |
| Title | Cluster Plot | Dendrogram | e-value | e-value | e-value | Condition | Condition FDR | Condition Difference |
|---|---|---|---|---|---|---|---|---|
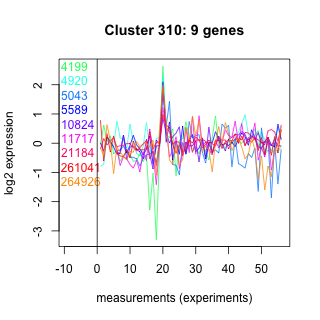
| Thaps_hclust_0310 |
 |
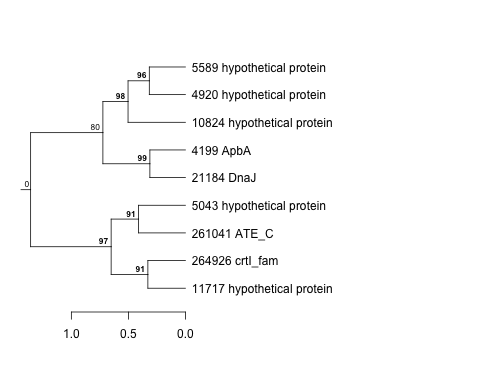 |
4.9 |
19 |
86 |
lowFe_TMEVA | 0.611000 | -0.205 |
| Thaps_hclust_0310 |
|
|
4.9 |
19 |
86 |
exponential_vs_stationary_24light | 0.391000 | -0.39 |
| Thaps_hclust_0310 |
|
|
4.9 |
19 |
86 |
lowN_TMEVA | 0.615000 | 0.229 |
| Thaps_hclust_0310 |
|
|
4.9 |
19 |
86 |
diel_exponential_vs_stationary | 0.437000 | -0.22 |
| Thaps_hclust_0310 |
|
|
4.9 |
19 |
86 |
lowSi_TMEVA | 1.000000 | 0.0292 |
| Thaps_hclust_0310 |
|
|
4.9 |
19 |
86 |
highlight_arrays | 0.337000 | 0.229 |
| Thaps_hclust_0310 |
|
|
4.9 |
19 |
86 |
diel_light_vs_dark | 0.871000 | -0.0732 |
| Thaps_hclust_0310 |
|
|
4.9 |
19 |
86 |
lowFe_KTKB_Day3 | 0.412000 | -0.305 |
| Thaps_hclust_0310 |
|
|
4.9 |
19 |
86 |
lowFe_KTKB_Day5 | 0.115000 | -0.481 |
| Thaps_hclust_0310 |
|
|
4.9 |
19 |
86 |
BaP | 0.254000 | 0.376 |
| Thaps_hclust_0310 |
|
|
4.9 |
19 |
86 |
exponential_vs_stationary_24highlight | 0.521000 | -0.106 |
| Thaps_hclust_0310 |
|
|
4.9 |
19 |
86 |
co2_elevated_stat_arrays | 0.802000 | 0.084 |
| Thaps_hclust_0310 |
|
|
4.9 |
19 |
86 |
lowtemp_TMEVA | 0.596000 | -0.204 |
| Thaps_hclust_0310 |
|
|
4.9 |
19 |
86 |
highpH_TMEVA | 0.807000 | -0.0669 |
| Thaps_hclust_0310 |
|
|
4.9 |
19 |
86 |
co2_elevated_expo_arrays | 0.600000 | 0.15 |
| Title | Cluster Plot | Dendrogram | e-value | e-value | e-value | Condition | Condition FDR | Condition Difference |
|---|---|---|---|---|---|---|---|---|
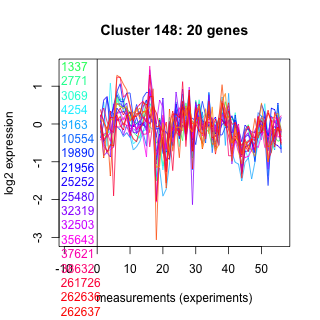
| Thaps_hclust_0148 |
 |
 |
4.7 |
39 |
51 |
lowFe_KTKB_Day5 | 0.068400 | 0.357 |
| Thaps_hclust_0148 |
|
|
4.7 |
39 |
51 |
BaP | 0.001620 | -0.654 |
| Thaps_hclust_0148 |
|
|
4.7 |
39 |
51 |
exponential_vs_stationary_24highlight | 0.452000 | 0.0871 |
| Thaps_hclust_0148 |
|
|
4.7 |
39 |
51 |
co2_elevated_stat_arrays | 0.059800 | -0.409 |
| Thaps_hclust_0148 |
|
|
4.7 |
39 |
51 |
lowtemp_TMEVA | 0.640000 | -0.129 |
| Thaps_hclust_0148 |
|
|
4.7 |
39 |
51 |
highpH_TMEVA | 0.984000 | 0.00668 |
| Thaps_hclust_0148 |
|
|
4.7 |
39 |
51 |
co2_elevated_expo_arrays | 0.873000 | 0.0629 |
| Thaps_hclust_0148 |
|
|
4.7 |
39 |
51 |
lowFe_TMEVA | 0.549000 | -0.182 |
| Thaps_hclust_0148 |
|
|
4.7 |
39 |
51 |
exponential_vs_stationary_24light | 0.597000 | 0.194 |
| Thaps_hclust_0148 |
|
|
4.7 |
39 |
51 |
lowN_TMEVA | 0.505000 | -0.241 |
| Thaps_hclust_0148 |
|
|
4.7 |
39 |
51 |
diel_exponential_vs_stationary | 0.533000 | -0.126 |
| Thaps_hclust_0148 |
|
|
4.7 |
39 |
51 |
lowSi_TMEVA | 0.854000 | -0.205 |
| Thaps_hclust_0148 |
|
|
4.7 |
39 |
51 |
highlight_arrays | 0.047900 | -0.304 |
| Thaps_hclust_0148 |
|
|
4.7 |
39 |
51 |
diel_light_vs_dark | 0.307000 | -0.224 |
| Thaps_hclust_0148 |
|
|
4.7 |
39 |
51 |
lowFe_KTKB_Day3 | 0.023900 | 0.503 |
| Title | Cluster Plot | Dendrogram | e-value | e-value | e-value | Condition | Condition FDR | Condition Difference |
|---|---|---|---|---|---|---|---|---|
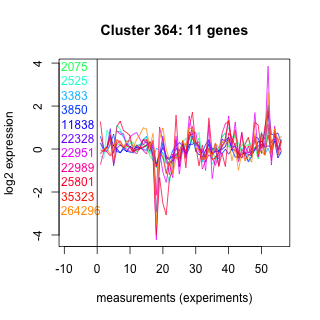
| Thaps_hclust_0364 |
 |
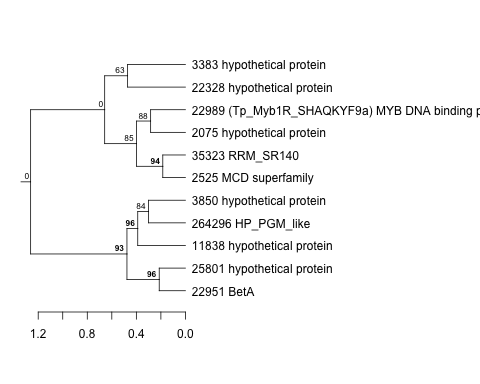 |
4.5 |
28 |
590 |
exponential_vs_stationary_24light | 0.102000 | -0.651 |
| Thaps_hclust_0364 |
|
|
4.5 |
28 |
590 |
lowN_TMEVA | 0.778000 | 0.121 |
| Thaps_hclust_0364 |
|
|
4.5 |
28 |
590 |
diel_exponential_vs_stationary | 0.026900 | -0.545 |
| Thaps_hclust_0364 |
|
|
4.5 |
28 |
590 |
lowSi_TMEVA | 0.614000 | 0.367 |
| Thaps_hclust_0364 |
|
|
4.5 |
28 |
590 |
highlight_arrays | 0.129000 | -0.321 |
| Thaps_hclust_0364 |
|
|
4.5 |
28 |
590 |
diel_light_vs_dark | 0.485000 | -0.217 |
| Thaps_hclust_0364 |
|
|
4.5 |
28 |
590 |
lowFe_KTKB_Day3 | 0.795000 | 0.0978 |
| Thaps_hclust_0364 |
|
|
4.5 |
28 |
590 |
lowFe_KTKB_Day5 | 0.990000 | 0.00503 |
| Thaps_hclust_0364 |
|
|
4.5 |
28 |
590 |
BaP | 0.007340 | -0.782 |
| Thaps_hclust_0364 |
|
|
4.5 |
28 |
590 |
exponential_vs_stationary_24highlight | 0.012200 | -0.361 |
| Thaps_hclust_0364 |
|
|
4.5 |
28 |
590 |
co2_elevated_stat_arrays | 0.406000 | 0.236 |
| Thaps_hclust_0364 |
|
|
4.5 |
28 |
590 |
lowtemp_TMEVA | 0.706000 | -0.131 |
| Thaps_hclust_0364 |
|
|
4.5 |
28 |
590 |
highpH_TMEVA | 0.749000 | 0.0802 |
| Thaps_hclust_0364 |
|
|
4.5 |
28 |
590 |
co2_elevated_expo_arrays | 0.911000 | -0.0564 |
| Thaps_hclust_0364 |
|
|
4.5 |
28 |
590 |
lowFe_TMEVA | 0.826000 | -0.0944 |
| Title | Cluster Plot | Dendrogram | e-value | e-value | e-value | Condition | Condition FDR | Condition Difference |
|---|---|---|---|---|---|---|---|---|
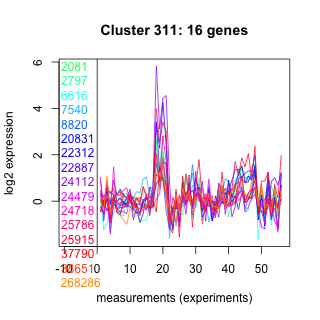
| Thaps_hclust_0311 |
 |
 |
4.1 |
0.64 |
12 |
exponential_vs_stationary_24light | 0.029800 | -0.737 |
| Thaps_hclust_0311 |
|
|
4.1 |
0.64 |
12 |
lowN_TMEVA | 0.469000 | 0.284 |
| Thaps_hclust_0311 |
|
|
4.1 |
0.64 |
12 |
diel_exponential_vs_stationary | 0.015400 | -0.479 |
| Thaps_hclust_0311 |
|
|
4.1 |
0.64 |
12 |
lowSi_TMEVA | 0.522000 | -0.415 |
| Thaps_hclust_0311 |
|
|
4.1 |
0.64 |
12 |
highlight_arrays | 0.000442 | 0.676 |
| Thaps_hclust_0311 |
|
|
4.1 |
0.64 |
12 |
diel_light_vs_dark | 0.685000 | -0.12 |
| Thaps_hclust_0311 |
|
|
4.1 |
0.64 |
12 |
lowFe_KTKB_Day3 | 0.864000 | -0.0564 |
| Thaps_hclust_0311 |
|
|
4.1 |
0.64 |
12 |
lowFe_KTKB_Day5 | 0.477000 | 0.168 |
| Thaps_hclust_0311 |
|
|
4.1 |
0.64 |
12 |
BaP | 0.000370 | 1.68 |
| Thaps_hclust_0311 |
|
|
4.1 |
0.64 |
12 |
exponential_vs_stationary_24highlight | 0.003230 | -0.345 |
| Thaps_hclust_0311 |
|
|
4.1 |
0.64 |
12 |
co2_elevated_stat_arrays | 0.032300 | 0.494 |
| Thaps_hclust_0311 |
|
|
4.1 |
0.64 |
12 |
lowtemp_TMEVA | 0.445000 | 0.219 |
| Thaps_hclust_0311 |
|
|
4.1 |
0.64 |
12 |
highpH_TMEVA | 0.647000 | 0.0937 |
| Thaps_hclust_0311 |
|
|
4.1 |
0.64 |
12 |
co2_elevated_expo_arrays | 0.464000 | 0.154 |
| Thaps_hclust_0311 |
|
|
4.1 |
0.64 |
12 |
lowFe_TMEVA | 0.316000 | -0.306 |
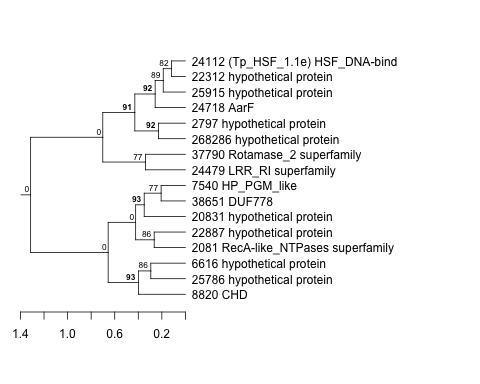
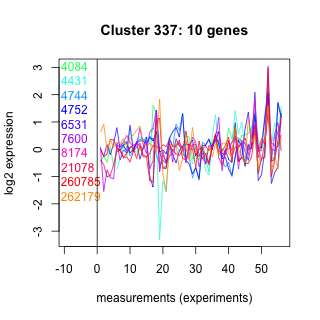
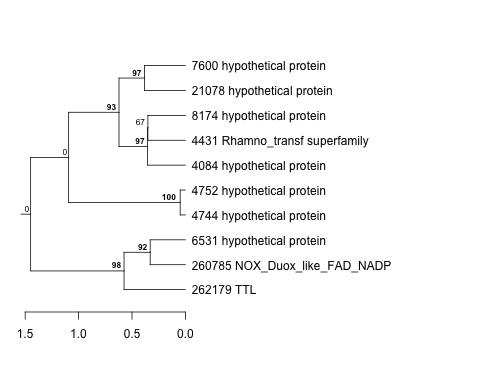
| Title | Cluster Plot | Dendrogram | e-value | e-value | e-value | Condition | Condition FDR | Condition Difference |
|---|---|---|---|---|---|---|---|---|
| Thaps_hclust_0337 |
 |
 |
3.5 |
3 |
280 |
lowFe_KTKB_Day3 | 0.617000 | -0.179 |
| Thaps_hclust_0337 |
|
|
3.5 |
3 |
280 |
lowFe_KTKB_Day5 | 0.724000 | 0.108 |
| Thaps_hclust_0337 |
|
|
3.5 |
3 |
280 |
BaP | 0.616000 | -0.167 |
| Thaps_hclust_0337 |
|
|
3.5 |
3 |
280 |
exponential_vs_stationary_24highlight | 0.000526 | -0.534 |
| Thaps_hclust_0337 |
|
|
3.5 |
3 |
280 |
co2_elevated_stat_arrays | 0.001700 | 0.946 |
| Thaps_hclust_0337 |
|
|
3.5 |
3 |
280 |
lowtemp_TMEVA | 0.432000 | -0.28 |
| Thaps_hclust_0337 |
|
|
3.5 |
3 |
280 |
highpH_TMEVA | 0.965000 | -0.0173 |
| Thaps_hclust_0337 |
|
|
3.5 |
3 |
280 |
co2_elevated_expo_arrays | 0.008700 | 0.516 |
| Thaps_hclust_0337 |
|
|
3.5 |
3 |
280 |
lowFe_TMEVA | 0.373000 | -0.328 |
| Thaps_hclust_0337 |
|
|
3.5 |
3 |
280 |
exponential_vs_stationary_24light | 0.089400 | -0.712 |