Hierarchical Clusters
Displaying 501 - 600 of 7500
| Title | Cluster Plot | Dendrogram | e-value | e-value | e-value | Condition | Condition FDR | Condition Difference |
|---|---|---|---|---|---|---|---|---|
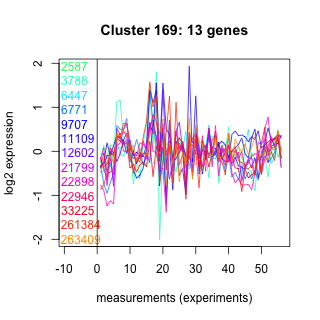
| Thaps_hclust_0169 |
 |
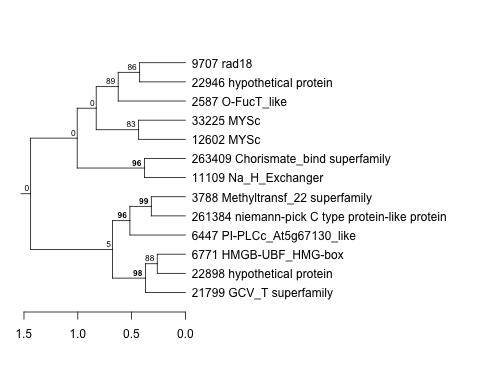 |
2.2 |
23 |
3.9 |
lowtemp_TMEVA | 0.242000 | -0.367 |
| Thaps_hclust_0169 |
|
|
2.2 |
23 |
3.9 |
highpH_TMEVA | 0.057100 | -0.372 |
| Thaps_hclust_0169 |
|
|
2.2 |
23 |
3.9 |
co2_elevated_expo_arrays | 0.589000 | 0.138 |
| Thaps_hclust_0169 |
|
|
2.2 |
23 |
3.9 |
lowFe_TMEVA | 0.300000 | -0.334 |
| Thaps_hclust_0169 |
|
|
2.2 |
23 |
3.9 |
exponential_vs_stationary_24light | 0.821000 | 0.107 |
| Title | Cluster Plot | Dendrogram | e-value | e-value | e-value | Condition | Condition FDR | Condition Difference |
|---|---|---|---|---|---|---|---|---|
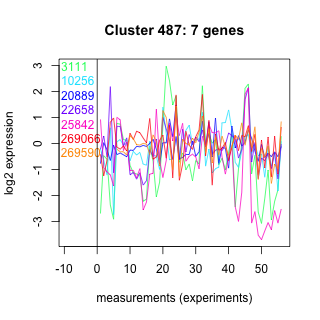
| Thaps_hclust_0487 |
 |
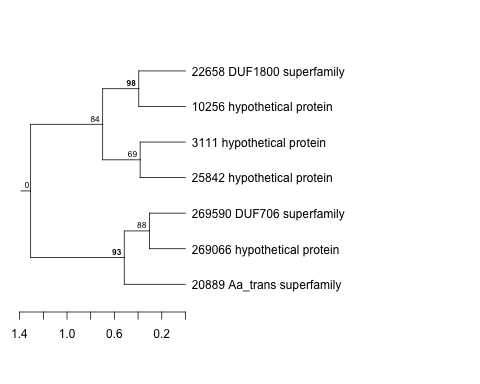 |
2.2 |
14 |
320 |
co2_elevated_stat_arrays | 0.922000 | 0.0402 |
| Thaps_hclust_0487 |
|
|
2.2 |
14 |
320 |
lowtemp_TMEVA | 0.016500 | -1.25 |
| Thaps_hclust_0487 |
|
|
2.2 |
14 |
320 |
highpH_TMEVA | 0.036100 | -0.563 |
| Thaps_hclust_0487 |
|
|
2.2 |
14 |
320 |
co2_elevated_expo_arrays | 0.008700 | -0.57 |
| Thaps_hclust_0487 |
|
|
2.2 |
14 |
320 |
lowFe_TMEVA | 0.251000 | -0.49 |
| Title | Cluster Plot | Dendrogram | e-value | e-value | e-value | Condition | Condition FDR | Condition Difference |
|---|---|---|---|---|---|---|---|---|
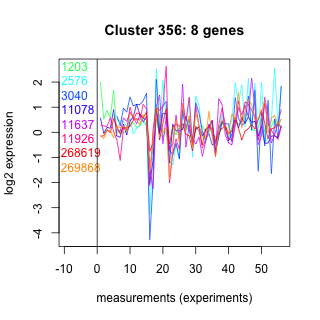
| Thaps_hclust_0356 |
 |
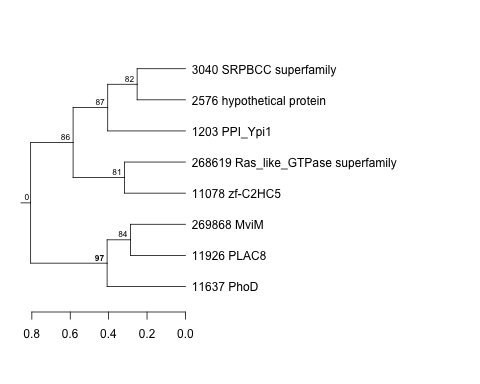 |
2.1 |
41 |
71 |
exponential_vs_stationary_24highlight | 0.112000 | -0.264 |
| Thaps_hclust_0356 |
|
|
2.1 |
41 |
71 |
co2_elevated_stat_arrays | 0.626000 | -0.161 |
| Thaps_hclust_0356 |
|
|
2.1 |
41 |
71 |
lowtemp_TMEVA | 0.146000 | 0.584 |
| Thaps_hclust_0356 |
|
|
2.1 |
41 |
71 |
highpH_TMEVA | 0.038800 | 0.518 |
| Thaps_hclust_0356 |
|
|
2.1 |
41 |
71 |
co2_elevated_expo_arrays | 0.068800 | 0.382 |
| Thaps_hclust_0356 |
|
|
2.1 |
41 |
71 |
lowFe_TMEVA | 0.886000 | 0.0714 |
| Thaps_hclust_0356 |
|
|
2.1 |
41 |
71 |
exponential_vs_stationary_24light | 0.291000 | -0.5 |
| Thaps_hclust_0356 |
|
|
2.1 |
41 |
71 |
lowN_TMEVA | 0.524000 | 0.291 |
| Thaps_hclust_0356 |
|
|
2.1 |
41 |
71 |
diel_exponential_vs_stationary | 0.169000 | -0.394 |
| Thaps_hclust_0356 |
|
|
2.1 |
41 |
71 |
lowSi_TMEVA | 0.806000 | 0.277 |
| Thaps_hclust_0356 |
|
|
2.1 |
41 |
71 |
highlight_arrays | 0.153000 | 0.348 |
| Thaps_hclust_0356 |
|
|
2.1 |
41 |
71 |
diel_light_vs_dark | 0.781000 | -0.12 |
| Thaps_hclust_0356 |
|
|
2.1 |
41 |
71 |
lowFe_KTKB_Day3 | 0.000862 | -2.07 |
| Thaps_hclust_0356 |
|
|
2.1 |
41 |
71 |
lowFe_KTKB_Day5 | 0.008930 | -0.954 |
| Thaps_hclust_0356 |
|
|
2.1 |
41 |
71 |
BaP | 0.024900 | 0.763 |
| Title | Cluster Plot | Dendrogram | e-value | e-value | e-value | Condition | Condition FDR | Condition Difference |
|---|---|---|---|---|---|---|---|---|
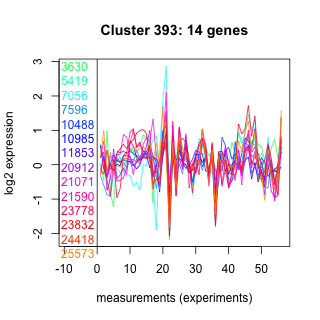
| Thaps_hclust_0393 |
 |
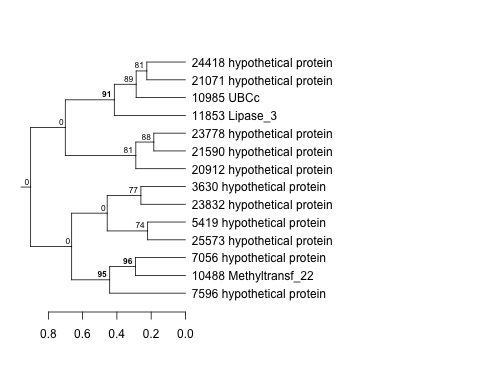 |
2 |
16 |
16 |
co2_elevated_stat_arrays | 0.209000 | 0.319 |
| Thaps_hclust_0393 |
|
|
2 |
16 |
16 |
lowtemp_TMEVA | 0.825000 | -0.0751 |
| Thaps_hclust_0393 |
|
|
2 |
16 |
16 |
highpH_TMEVA | 0.664000 | 0.0938 |
| Thaps_hclust_0393 |
|
|
2 |
16 |
16 |
co2_elevated_expo_arrays | 0.911000 | -0.054 |
| Thaps_hclust_0393 |
|
|
2 |
16 |
16 |
lowFe_TMEVA | 0.776000 | 0.119 |
| Thaps_hclust_0393 |
|
|
2 |
16 |
16 |
exponential_vs_stationary_24light | 0.346000 | -0.354 |
| Thaps_hclust_0393 |
|
|
2 |
16 |
16 |
lowN_TMEVA | 0.608000 | -0.208 |
| Thaps_hclust_0393 |
|
|
2 |
16 |
16 |
diel_exponential_vs_stationary | 0.597000 | -0.127 |
| Thaps_hclust_0393 |
|
|
2 |
16 |
16 |
lowSi_TMEVA | 0.844000 | -0.218 |
| Thaps_hclust_0393 |
|
|
2 |
16 |
16 |
highlight_arrays | 0.027300 | 0.404 |
| Thaps_hclust_0393 |
|
|
2 |
16 |
16 |
diel_light_vs_dark | 0.019500 | 0.549 |
| Thaps_hclust_0393 |
|
|
2 |
16 |
16 |
lowFe_KTKB_Day3 | 0.118000 | 0.435 |
| Thaps_hclust_0393 |
|
|
2 |
16 |
16 |
lowFe_KTKB_Day5 | 0.767000 | -0.0803 |
| Thaps_hclust_0393 |
|
|
2 |
16 |
16 |
BaP | 0.099300 | 0.414 |
| Thaps_hclust_0393 |
|
|
2 |
16 |
16 |
exponential_vs_stationary_24highlight | 0.374000 | -0.119 |
| Title | Cluster Plot | Dendrogram | e-value | e-value | e-value | Condition | Condition FDR | Condition Difference |
|---|---|---|---|---|---|---|---|---|
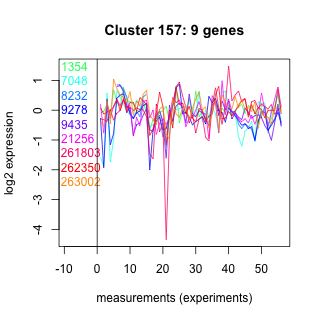
| Thaps_hclust_0157 |
 |
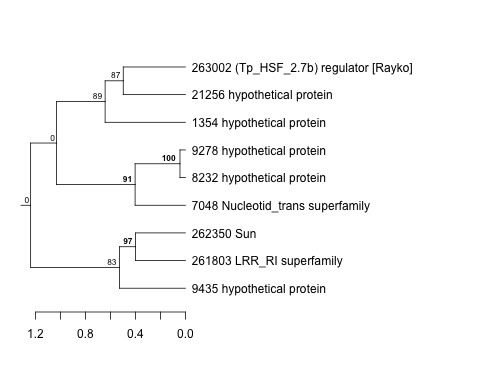 |
2 |
4.6 |
4.9 |
lowFe_TMEVA | 0.033600 | -0.801 |
| Thaps_hclust_0157 |
|
|
2 |
4.6 |
4.9 |
exponential_vs_stationary_24light | 0.837000 | 0.113 |
| Thaps_hclust_0157 |
|
|
2 |
4.6 |
4.9 |
lowN_TMEVA | 0.699000 | 0.18 |
| Thaps_hclust_0157 |
|
|
2 |
4.6 |
4.9 |
diel_exponential_vs_stationary | 0.965000 | 0.017 |
| Thaps_hclust_0157 |
|
|
2 |
4.6 |
4.9 |
lowSi_TMEVA | 0.436000 | -0.54 |
| Thaps_hclust_0157 |
|
|
2 |
4.6 |
4.9 |
highlight_arrays | 0.819000 | -0.0582 |
| Thaps_hclust_0157 |
|
|
2 |
4.6 |
4.9 |
diel_light_vs_dark | 0.882000 | -0.0678 |
| Thaps_hclust_0157 |
|
|
2 |
4.6 |
4.9 |
lowFe_KTKB_Day3 | 0.022400 | -0.826 |
| Thaps_hclust_0157 |
|
|
2 |
4.6 |
4.9 |
lowFe_KTKB_Day5 | 0.056800 | -0.596 |
| Thaps_hclust_0157 |
|
|
2 |
4.6 |
4.9 |
BaP | 0.130000 | -0.48 |
| Thaps_hclust_0157 |
|
|
2 |
4.6 |
4.9 |
exponential_vs_stationary_24highlight | 0.633000 | 0.0815 |
| Thaps_hclust_0157 |
|
|
2 |
4.6 |
4.9 |
co2_elevated_stat_arrays | 0.405000 | -0.254 |
| Thaps_hclust_0157 |
|
|
2 |
4.6 |
4.9 |
lowtemp_TMEVA | 0.966000 | -0.0202 |
| Thaps_hclust_0157 |
|
|
2 |
4.6 |
4.9 |
highpH_TMEVA | 0.142000 | -0.331 |
| Thaps_hclust_0157 |
|
|
2 |
4.6 |
4.9 |
co2_elevated_expo_arrays | 0.580000 | 0.157 |
| Title | Cluster Plot | Dendrogram | e-value | e-value | e-value | Condition | Condition FDR | Condition Difference |
|---|---|---|---|---|---|---|---|---|
| Thaps_hclust_0422 |
 |
 |
1.9 |
15 |
0.0027 |
diel_light_vs_dark | 0.017700 | -0.434 |
| Thaps_hclust_0422 |
|
|
1.9 |
15 |
0.0027 |
lowFe_KTKB_Day3 | 0.000862 | -1.06 |
| Thaps_hclust_0422 |
|
|
1.9 |
15 |
0.0027 |
lowFe_KTKB_Day5 | 0.146000 | -0.278 |
| Thaps_hclust_0422 |
|
|
1.9 |
15 |
0.0027 |
BaP | 0.000370 | -1.17 |
| Thaps_hclust_0422 |
|
|
1.9 |
15 |
0.0027 |
exponential_vs_stationary_24highlight | 0.000526 | -0.705 |
| Thaps_hclust_0422 |
|
|
1.9 |
15 |
0.0027 |
co2_elevated_stat_arrays | 0.615000 | 0.128 |
| Thaps_hclust_0422 |
|
|
1.9 |
15 |
0.0027 |
lowtemp_TMEVA | 0.023300 | -0.561 |
| Thaps_hclust_0422 |
|
|
1.9 |
15 |
0.0027 |
highpH_TMEVA | 0.964000 | 0.015 |
| Thaps_hclust_0422 |
|
|
1.9 |
15 |
0.0027 |
co2_elevated_expo_arrays | 0.145000 | 0.212 |
| Thaps_hclust_0422 |
|
|
1.9 |
15 |
0.0027 |
lowFe_TMEVA | 0.216000 | -0.33 |
| Thaps_hclust_0422 |
|
|
1.9 |
15 |
0.0027 |
exponential_vs_stationary_24light | 0.000581 | -1.75 |
| Thaps_hclust_0422 |
|
|
1.9 |
15 |
0.0027 |
lowN_TMEVA | 0.052200 | 0.599 |
| Thaps_hclust_0422 |
|
|
1.9 |
15 |
0.0027 |
diel_exponential_vs_stationary | 0.000602 | -1.22 |
| Thaps_hclust_0422 |
|
|
1.9 |
15 |
0.0027 |
lowSi_TMEVA | 1.000000 | 0.0343 |
| Thaps_hclust_0422 |
|
|
1.9 |
15 |
0.0027 |
highlight_arrays | 0.000442 | 0.591 |
| Title | Cluster Plot | Dendrogram | e-value | e-value | e-value | Condition | Condition FDR | Condition Difference |
|---|---|---|---|---|---|---|---|---|
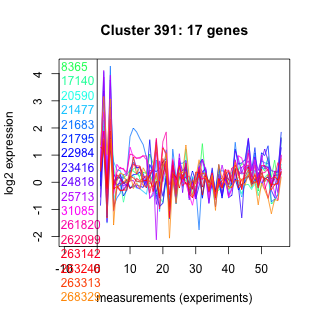
| Thaps_hclust_0391 |
 |
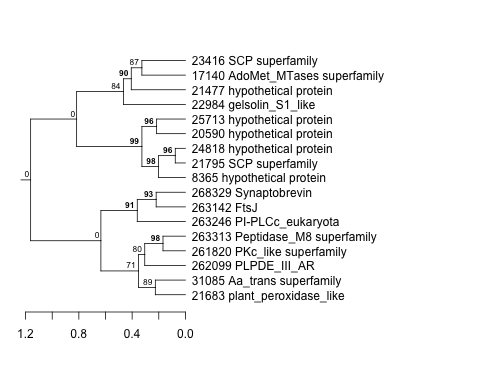 |
1.9 |
34 |
32 |
BaP | 0.227000 | 0.292 |
| Thaps_hclust_0391 |
|
|
1.9 |
34 |
32 |
exponential_vs_stationary_24highlight | 0.005770 | -0.321 |
| Thaps_hclust_0391 |
|
|
1.9 |
34 |
32 |
co2_elevated_stat_arrays | 0.953000 | -0.0141 |
| Thaps_hclust_0391 |
|
|
1.9 |
34 |
32 |
lowtemp_TMEVA | 0.263000 | -0.314 |
| Thaps_hclust_0391 |
|
|
1.9 |
34 |
32 |
highpH_TMEVA | 0.124000 | 0.262 |
| Thaps_hclust_0391 |
|
|
1.9 |
34 |
32 |
co2_elevated_expo_arrays | 0.563000 | 0.132 |
| Thaps_hclust_0391 |
|
|
1.9 |
34 |
32 |
lowFe_TMEVA | 0.001040 | 2.32 |
| Thaps_hclust_0391 |
|
|
1.9 |
34 |
32 |
exponential_vs_stationary_24light | 0.230000 | -0.406 |
| Thaps_hclust_0391 |
|
|
1.9 |
34 |
32 |
lowN_TMEVA | 0.113000 | -0.546 |
| Thaps_hclust_0391 |
|
|
1.9 |
34 |
32 |
diel_exponential_vs_stationary | 0.797000 | -0.0601 |
| Thaps_hclust_0391 |
|
|
1.9 |
34 |
32 |
lowSi_TMEVA | 0.001350 | 2.41 |
| Thaps_hclust_0391 |
|
|
1.9 |
34 |
32 |
highlight_arrays | 0.650000 | 0.0883 |
| Thaps_hclust_0391 |
|
|
1.9 |
34 |
32 |
diel_light_vs_dark | 0.018500 | 0.494 |
| Thaps_hclust_0391 |
|
|
1.9 |
34 |
32 |
lowFe_KTKB_Day3 | 0.375000 | 0.24 |
| Thaps_hclust_0391 |
|
|
1.9 |
34 |
32 |
lowFe_KTKB_Day5 | 0.475000 | 0.166 |
| Title | Cluster Plot | Dendrogram | e-value | e-value | e-value | Condition | Condition FDR | Condition Difference |
|---|---|---|---|---|---|---|---|---|
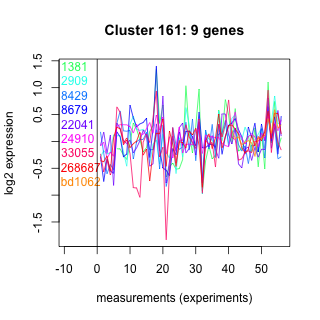
| Thaps_hclust_0161 |
 |
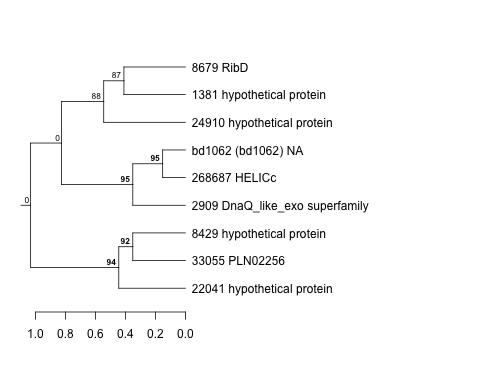 |
1.8 |
13 |
18 |
lowSi_TMEVA | 0.663000 | -0.351 |
| Thaps_hclust_0161 |
|
|
1.8 |
13 |
18 |
highlight_arrays | 0.544000 | -0.149 |
| Thaps_hclust_0161 |
|
|
1.8 |
13 |
18 |
diel_light_vs_dark | 0.426000 | 0.27 |
| Thaps_hclust_0161 |
|
|
1.8 |
13 |
18 |
lowFe_KTKB_Day3 | 0.604000 | -0.193 |
| Thaps_hclust_0161 |
|
|
1.8 |
13 |
18 |
lowFe_KTKB_Day5 | 0.902000 | 0.0433 |
| Thaps_hclust_0161 |
|
|
1.8 |
13 |
18 |
BaP | 0.954000 | 0.023 |
| Thaps_hclust_0161 |
|
|
1.8 |
13 |
18 |
exponential_vs_stationary_24highlight | 0.847000 | -0.0357 |
| Title | Cluster Plot | Dendrogram | e-value | e-value | e-value | Condition | Condition FDR | Condition Difference |
|---|---|---|---|---|---|---|---|---|
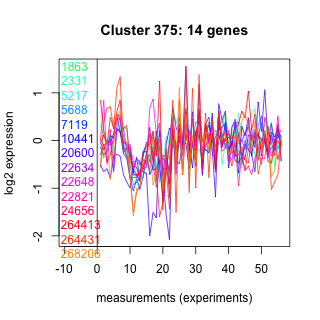
| Thaps_hclust_0375 |
 |
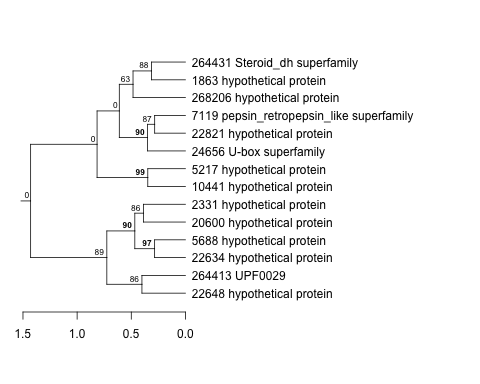 |
1.8 |
2.9 |
40 |
co2_elevated_stat_arrays | 0.951000 | -0.0179 |
| Thaps_hclust_0375 |
|
|
1.8 |
2.9 |
40 |
lowtemp_TMEVA | 0.619000 | -0.156 |
| Thaps_hclust_0375 |
|
|
1.8 |
2.9 |
40 |
highpH_TMEVA | 0.758000 | -0.0706 |
| Thaps_hclust_0375 |
|
|
1.8 |
2.9 |
40 |
co2_elevated_expo_arrays | 0.796000 | 0.0905 |
| Thaps_hclust_0375 |
|
|
1.8 |
2.9 |
40 |
lowFe_TMEVA | 0.978000 | -0.0169 |
| Thaps_hclust_0375 |
|
|
1.8 |
2.9 |
40 |
exponential_vs_stationary_24light | 0.800000 | 0.123 |
| Thaps_hclust_0375 |
|
|
1.8 |
2.9 |
40 |
lowN_TMEVA | 0.761000 | -0.134 |
| Thaps_hclust_0375 |
|
|
1.8 |
2.9 |
40 |
diel_exponential_vs_stationary | 0.349000 | -0.213 |