Hierarchical Clusters
Displaying 701 - 800 of 7500
| Title | Cluster Plot | Dendrogram | e-value | e-value | e-value | Condition | Condition FDR | Condition Difference |
|---|---|---|---|---|---|---|---|---|
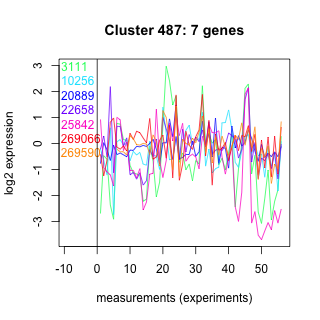
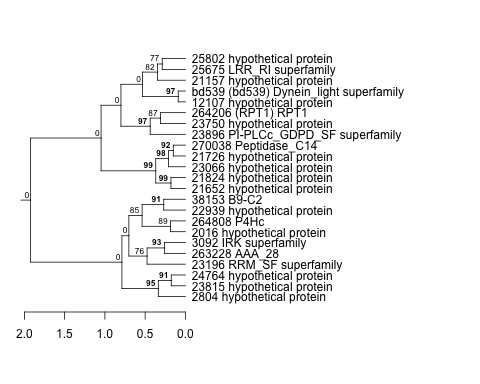
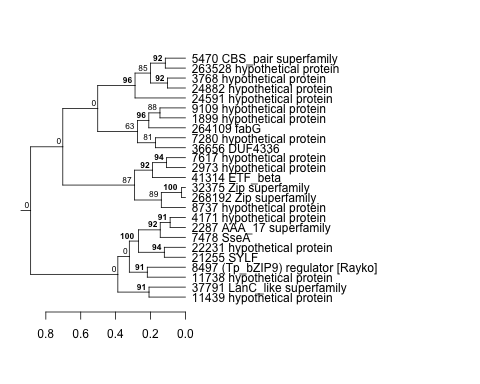
| Thaps_hclust_0487 |
 |
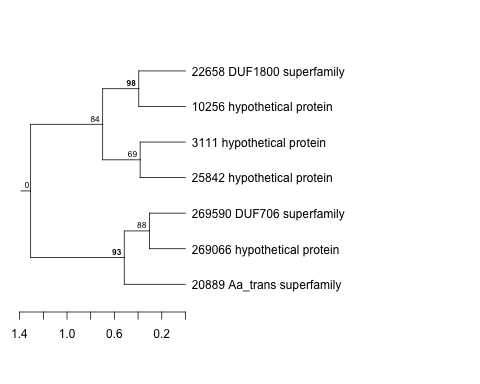 |
2.2 |
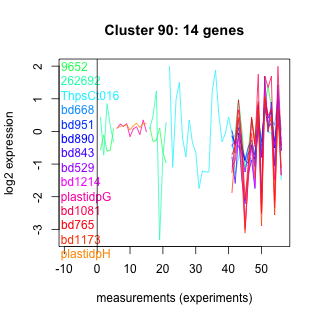
14 |
320 |
highpH_TMEVA | 0.036100 | -0.563 |
| Title | Cluster Plot | Dendrogram | e-value | e-value | e-value | Condition | Condition FDR | Condition Difference |
|---|---|---|---|---|---|---|---|---|
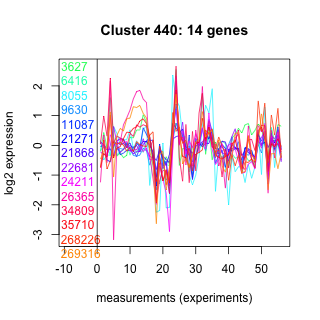
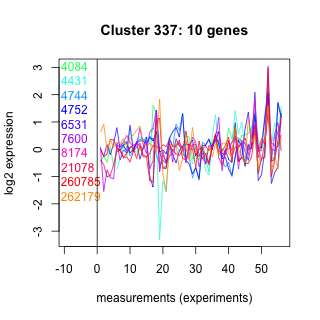
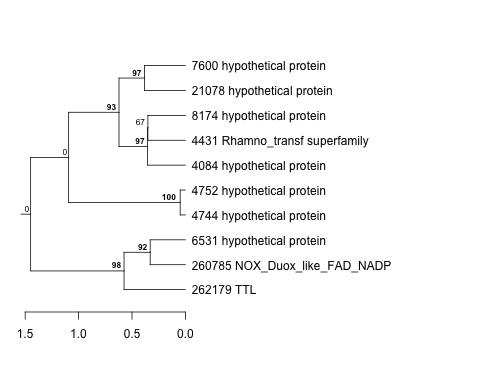
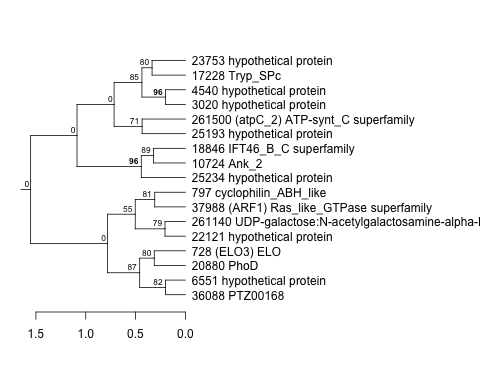
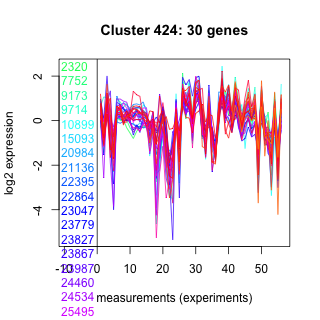
| Thaps_hclust_0440 |
 |
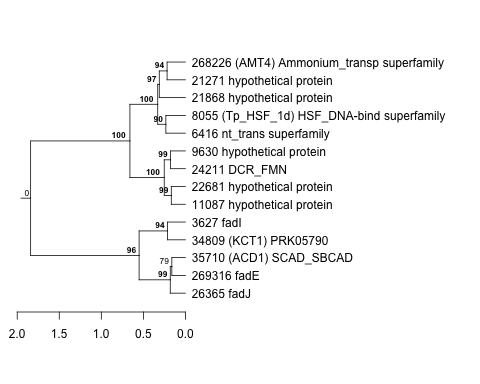 |
0.68 |
4.6 |
250 |
co2_elevated_stat_arrays | 0.022700 | -0.562 |
| Title | Cluster Plot | Dendrogram | e-value | e-value | e-value | Condition | Condition FDR | Condition Difference |
|---|---|---|---|---|---|---|---|---|
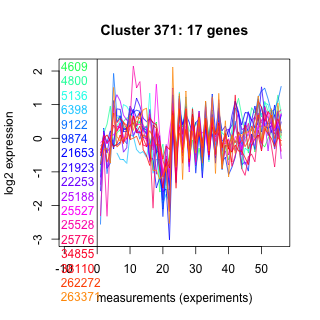
| Thaps_hclust_0060 |
 |
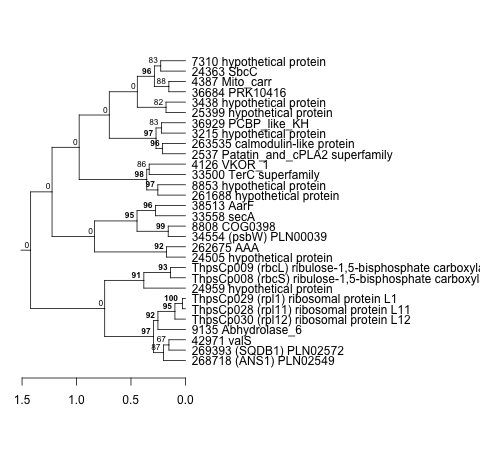 |
0.00000047 |
0.00077 |
0.0075 |
lowN_TMEVA | 0.026800 | -0.562 |
| Thaps_hclust_0060 |
|
|
0.00000047 |
0.00077 |
0.0075 |
BaP | 0.001910 | -0.537 |
| Title | Cluster Plot | Dendrogram | e-value | e-value | e-value | Condition | Condition FDR | Condition Difference |
|---|---|---|---|---|---|---|---|---|
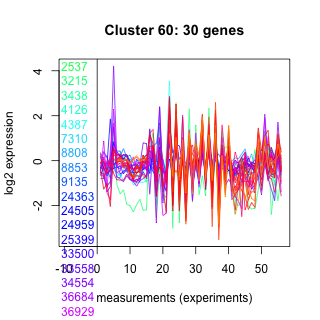
| Thaps_hclust_0188 |
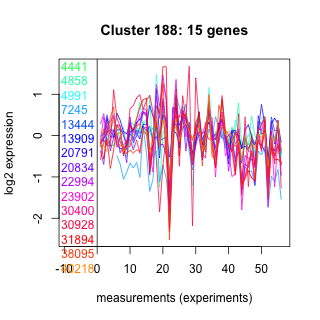 |
 |
0.0058 |
0.31 |
0.34 |
co2_elevated_stat_arrays | 0.011500 | -0.562 |
| Title | Cluster Plot | Dendrogram | e-value | e-value | e-value | Condition | Condition FDR | Condition Difference |
|---|---|---|---|---|---|---|---|---|
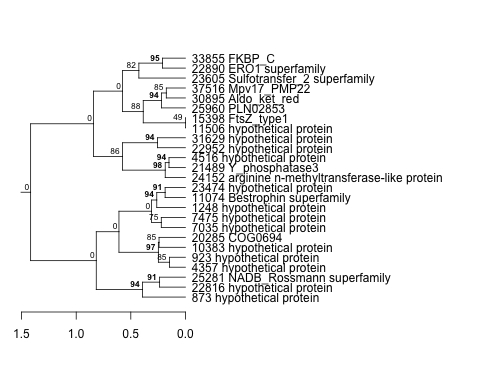
| Thaps_hclust_0355 |
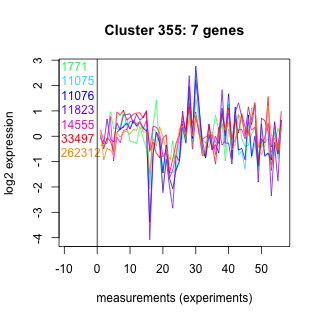 |
 |
0.49 |
16 |
310 |
exponential_vs_stationary_24highlight | 0.002480 | -0.562 |
| Title | Cluster Plot | Dendrogram | e-value | e-value | e-value | Condition | Condition FDR | Condition Difference |
|---|---|---|---|---|---|---|---|---|
| Thaps_hclust_0422 |
 |
 |
1.9 |
15 |
0.0027 |
lowtemp_TMEVA | 0.023300 | -0.561 |
| Title | Cluster Plot | Dendrogram | e-value | e-value | e-value | Condition | Condition FDR | Condition Difference |
|---|---|---|---|---|---|---|---|---|
| Thaps_hclust_0336 |
 |
 |
8.7e-23 |
0.00000000000015 |
0.0000000000000032 |
highpH_TMEVA | 0.009260 | -0.561 |
| Title | Cluster Plot | Dendrogram | e-value | e-value | e-value | Condition | Condition FDR | Condition Difference |
|---|---|---|---|---|---|---|---|---|
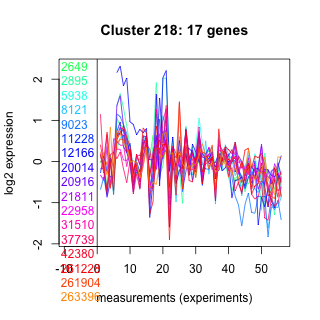
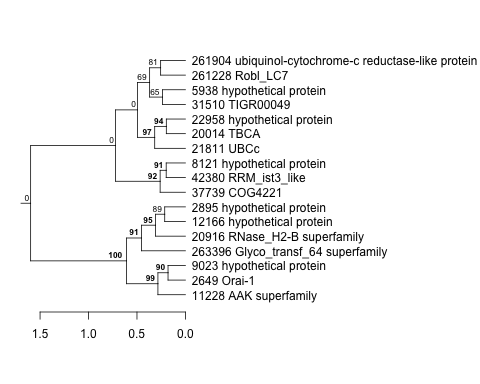
| Thaps_hclust_0218 |
 |
 |
0.02 |
0.065 |
7.1 |
lowFe_KTKB_Day3 | 0.023000 | -0.561 |
| Title | Cluster Plot | Dendrogram | e-value | e-value | e-value | Condition | Condition FDR | Condition Difference |
|---|---|---|---|---|---|---|---|---|
| Thaps_hclust_0030 |
 |
 |
0.000056 |
0.048 |
0.088 |
highlight_arrays | 0.000442 | -0.561 |
| Title | Cluster Plot | Dendrogram | e-value | e-value | e-value | Condition | Condition FDR | Condition Difference |
|---|---|---|---|---|---|---|---|---|
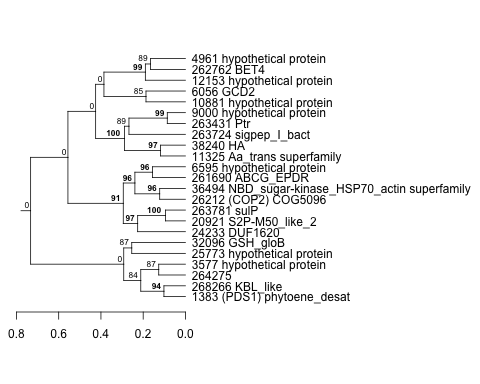
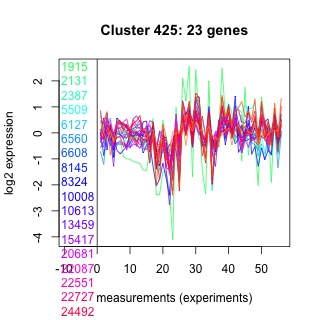
| Thaps_hclust_0425 |
 |
 |
0.017 |
1.1 |
140 |
exponential_vs_stationary_24light | 0.054300 | -0.56 |
| Title | Cluster Plot | Dendrogram | e-value | e-value | e-value | Condition | Condition FDR | Condition Difference |
|---|---|---|---|---|---|---|---|---|
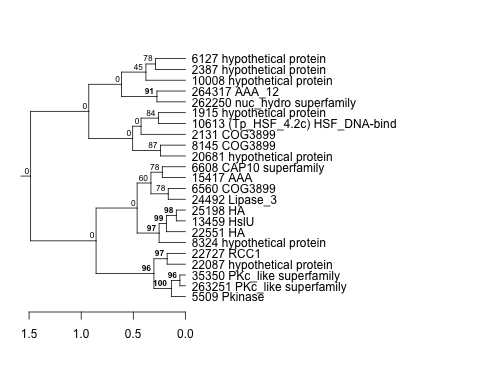
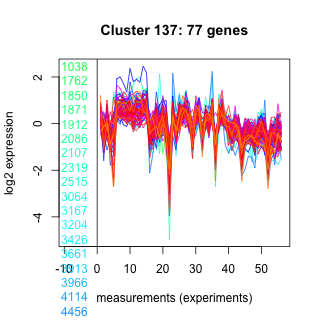
| Thaps_hclust_0137 |
 |
|
2.3e-18 |
0.00000000000062 |
0.000025 |
co2_elevated_stat_arrays | 0.000658 | -0.56 |
| Title | Cluster Plot | Dendrogram | e-value | e-value | e-value | Condition | Condition FDR | Condition Difference |
|---|---|---|---|---|---|---|---|---|
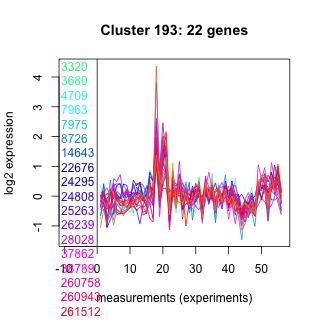
| Thaps_hclust_0193 |
 |
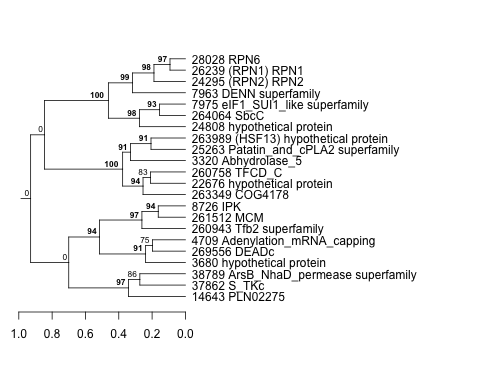 |
0.00027 |
0.013 |
6.2 |
highlight_arrays | 0.000442 | -0.56 |
| Title | Cluster Plot | Dendrogram | e-value | e-value | e-value | Condition | Condition FDR | Condition Difference |
|---|---|---|---|---|---|---|---|---|
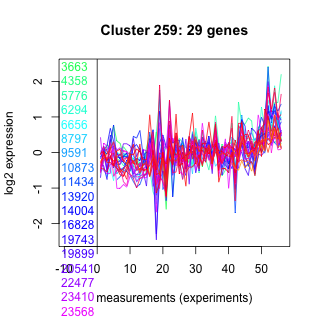
| Thaps_hclust_0259 |
 |
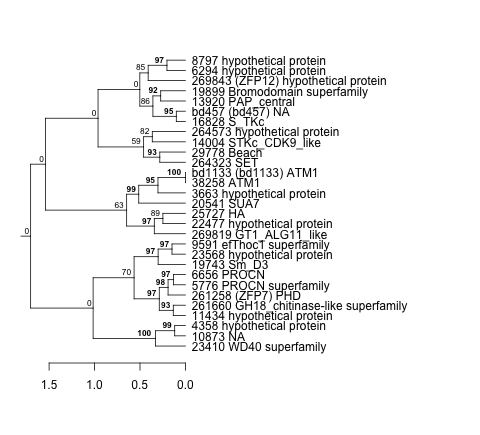 |
0.000051 |
0.026 |
17 |
highlight_arrays | 0.000442 | -0.56 |
| Title | Cluster Plot | Dendrogram | e-value | e-value | e-value | Condition | Condition FDR | Condition Difference |
|---|---|---|---|---|---|---|---|---|
| Thaps_hclust_0056 |
 |
 |
0.0000000078 |
0.077 |
1 |
lowSi_TMEVA | 0.220000 | -0.559 |
| Title | Cluster Plot | Dendrogram | e-value | e-value | e-value | Condition | Condition FDR | Condition Difference |
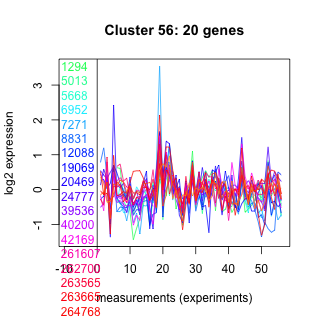
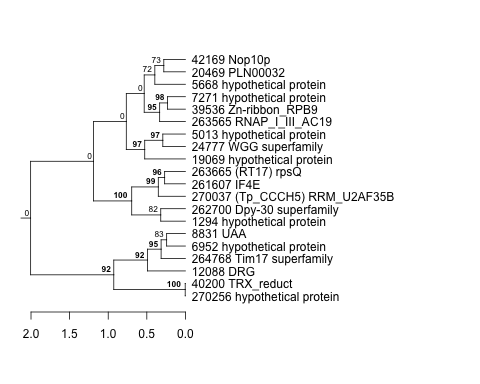
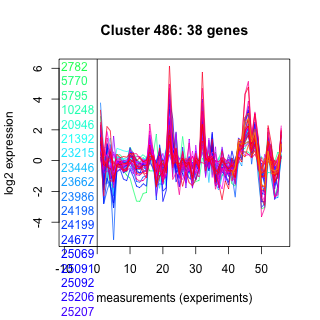
|---|---|---|---|---|---|---|---|---|
| Thaps_hclust_0486 |
 |
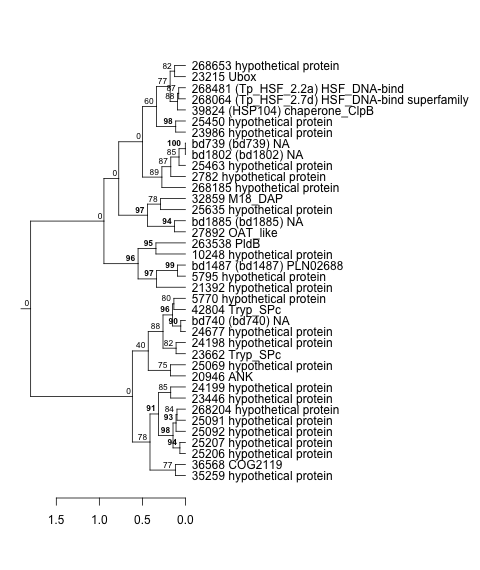 |
0.000000043 |
0.044 |
0.047 |
co2_elevated_expo_arrays | 0.001390 | -0.559 |
| Title | Cluster Plot | Dendrogram | e-value | e-value | e-value | Condition | Condition FDR | Condition Difference |
|---|---|---|---|---|---|---|---|---|
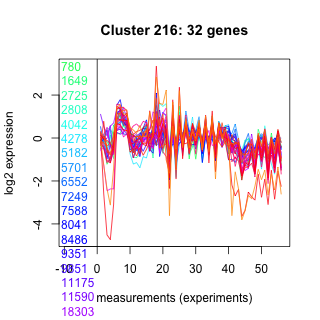
| Thaps_hclust_0216 |
 |
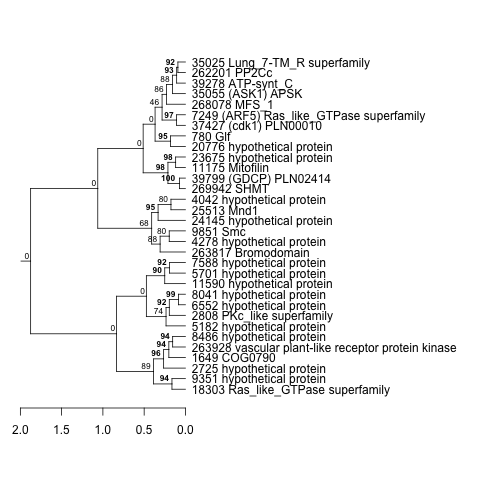 |
0.0000076 |
0.019 |
0.0036 |
lowtemp_TMEVA | 0.007830 | -0.559 |
| Title | Cluster Plot | Dendrogram | e-value | e-value | e-value | Condition | Condition FDR | Condition Difference |
|---|---|---|---|---|---|---|---|---|
| Thaps_hclust_0117 |
 |
 |
0.0000000000002 |
0.000000021 |
0.00000045 |
lowSi_TMEVA | 0.248000 | -0.559 |
| Thaps_hclust_0117 |
|
|
0.0000000000002 |
0.000000021 |
0.00000045 |
lowtemp_TMEVA | 0.036400 | -0.548 |
| Title | Cluster Plot | Dendrogram | e-value | e-value | e-value | Condition | Condition FDR | Condition Difference |
|---|---|---|---|---|---|---|---|---|
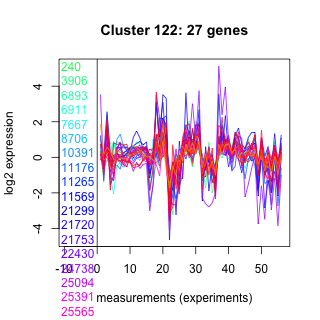
| Thaps_hclust_0122 |
 |
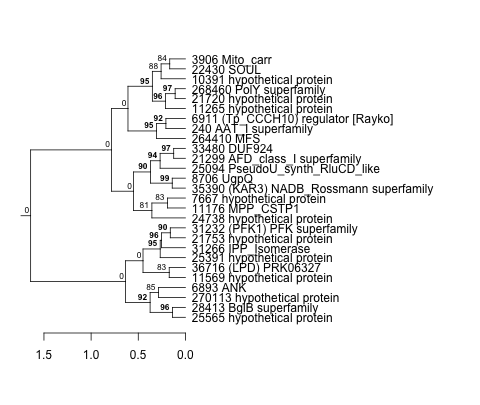 |
0.0000037 |
0.061 |
0.0018 |
lowFe_KTKB_Day3 | 0.000862 | -0.559 |
| Title | Cluster Plot | Dendrogram | e-value | e-value | e-value | Condition | Condition FDR | Condition Difference |
|---|---|---|---|---|---|---|---|---|
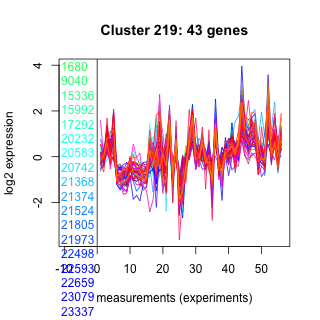
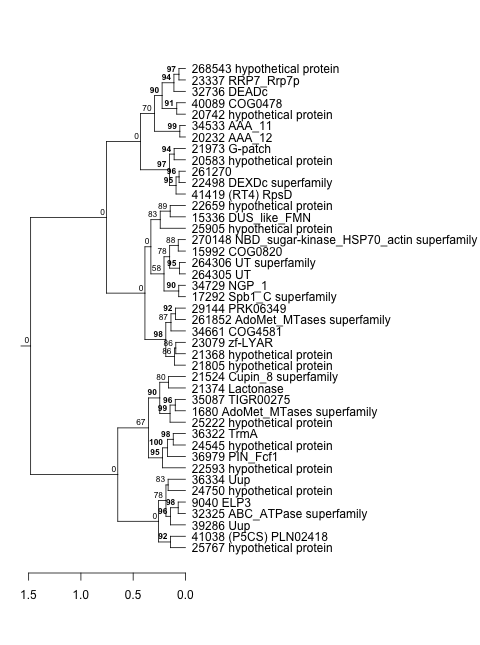
| Thaps_hclust_0219 |
 |
 |
2.8e-16 |
0.0000000055 |
0.012 |
diel_light_vs_dark | 0.000485 | -0.558 |
| Title | Cluster Plot | Dendrogram | e-value | e-value | e-value | Condition | Condition FDR | Condition Difference |
|---|---|---|---|---|---|---|---|---|
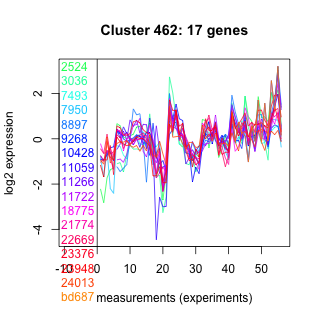
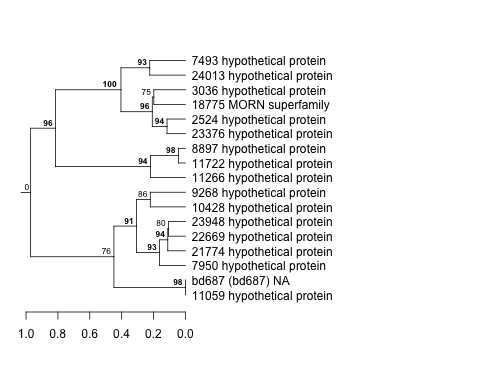
| Thaps_hclust_0462 |
 |
 |
0.0000000094 |
0.0000011 |
0.000046 |
lowFe_KTKB_Day5 | 0.009480 | -0.558 |
| Thaps_hclust_0462 |
|
|
0.0000000094 |
0.0000011 |
0.000046 |
lowN_TMEVA | 0.116000 | -0.54 |
| Title | Cluster Plot | Dendrogram | e-value | e-value | e-value | Condition | Condition FDR | Condition Difference |
|---|---|---|---|---|---|---|---|---|
| Thaps_hclust_0265 |
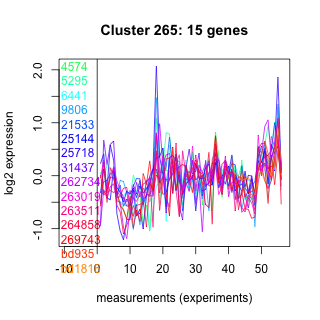 |
 |
0.02 |
0.000051 |
27 |
highlight_arrays | 0.001570 | -0.558 |
| Title | Cluster Plot | Dendrogram | e-value | e-value | e-value | Condition | Condition FDR | Condition Difference |
|---|---|---|---|---|---|---|---|---|
| Thaps_hclust_0108 |
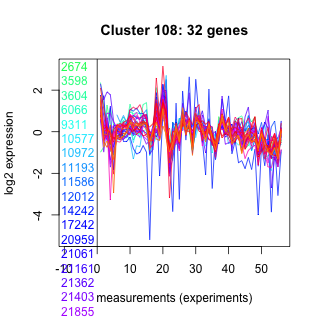 |
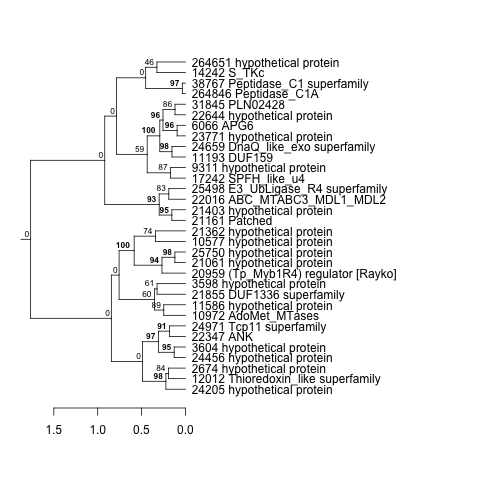 |
0.0000001 |
0.013 |
4 |
exponential_vs_stationary_24light | 0.019900 | -0.558 |
| Title | Cluster Plot | Dendrogram | e-value | e-value | e-value | Condition | Condition FDR | Condition Difference |
|---|---|---|---|---|---|---|---|---|
| Thaps_hclust_0263 |
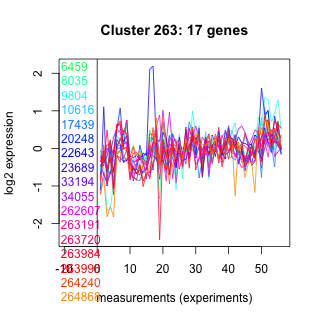 |
 |
0.15 |
0.25 |
1.4 |
lowtemp_TMEVA | 0.045600 | -0.557 |
| Title | Cluster Plot | Dendrogram | e-value | e-value | e-value | Condition | Condition FDR | Condition Difference |
|---|---|---|---|---|---|---|---|---|
| Thaps_hclust_0076 |
 |
 |
0.0047 |
0.13 |
1.2 |
highlight_arrays | 0.000442 | -0.556 |
| Title | Cluster Plot | Dendrogram | e-value | e-value | e-value | Condition | Condition FDR | Condition Difference |
|---|---|---|---|---|---|---|---|---|
| Thaps_hclust_0027 |
 |
 |
0.0000000084 |
0.0086 |
0.069 |
lowN_TMEVA | 0.043500 | -0.555 |
| Title | Cluster Plot | Dendrogram | e-value | e-value | e-value | Condition | Condition FDR | Condition Difference |
|---|---|---|---|---|---|---|---|---|
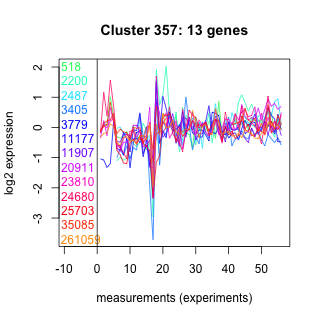
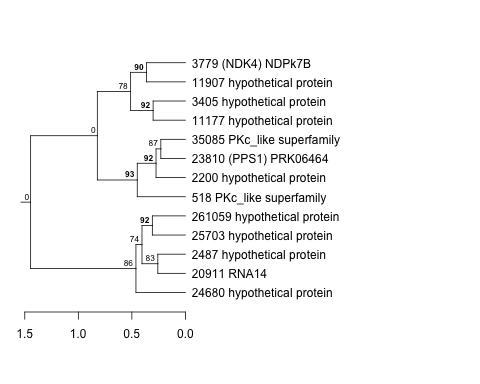
| Thaps_hclust_0357 |
 |
 |
0.077 |
0.1 |
0.81 |
lowFe_KTKB_Day3 | 0.056500 | -0.552 |
| Title | Cluster Plot | Dendrogram | e-value | e-value | e-value | Condition | Condition FDR | Condition Difference |
|---|---|---|---|---|---|---|---|---|
| Thaps_hclust_0048 |
 |
 |
4.8e-17 |
0.000000018 |
0.0000097 |
highlight_arrays | 0.000442 | -0.551 |
| Title | Cluster Plot | Dendrogram | e-value | e-value | e-value | Condition | Condition FDR | Condition Difference |
|---|---|---|---|---|---|---|---|---|
| Thaps_hclust_0411 |
 |
 |
0.00079 |
0.0092 |
0.029 |
diel_exponential_vs_stationary | 0.000602 | -0.551 |
| Title | Cluster Plot | Dendrogram | e-value | e-value | e-value | Condition | Condition FDR | Condition Difference |
|---|---|---|---|---|---|---|---|---|
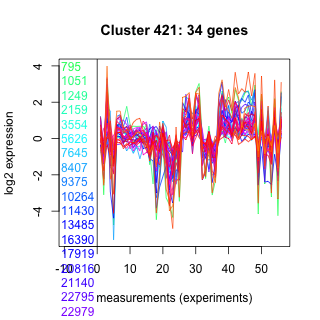
| Thaps_hclust_0421 |
 |
 |
0.0000074 |
0.00013 |
0.34 |
lowFe_KTKB_Day3 | 0.000862 | -0.551 |
| Title | Cluster Plot | Dendrogram | e-value | e-value | e-value | Condition | Condition FDR | Condition Difference |
|---|---|---|---|---|---|---|---|---|
| Thaps_hclust_0044 |
 |
 |
0.27 |
2.6 |
4.2 |
lowFe_TMEVA | 0.097300 | -0.55 |
| Title | Cluster Plot | Dendrogram | e-value | e-value | e-value | Condition | Condition FDR | Condition Difference |
|---|---|---|---|---|---|---|---|---|
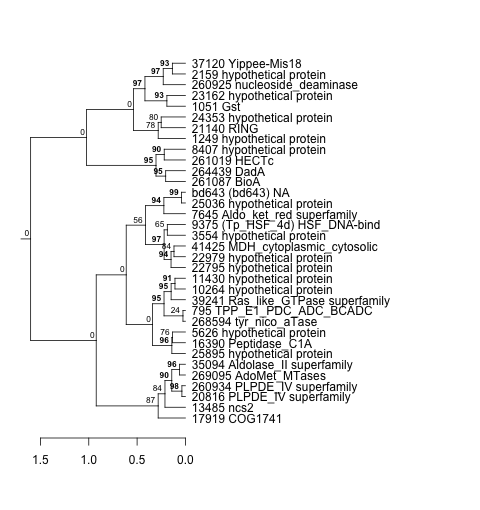
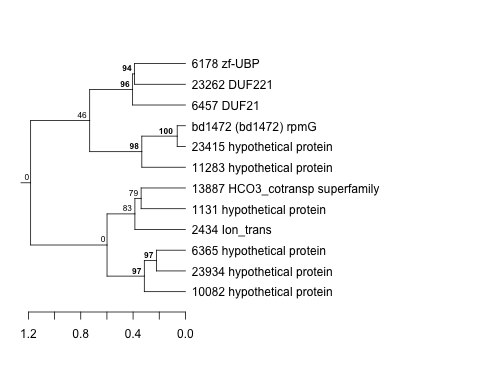
| Thaps_hclust_0141 |
 |
 |
0.000021 |
0.0007 |
0.0051 |
co2_elevated_stat_arrays | 0.001190 | -0.549 |
| Thaps_hclust_0141 |
|
|
0.000021 |
0.0007 |
0.0051 |
lowFe_TMEVA | 0.004550 | -0.549 |
| Title | Cluster Plot | Dendrogram | e-value | e-value | e-value | Condition | Condition FDR | Condition Difference |
|---|---|---|---|---|---|---|---|---|
| Thaps_hclust_0006 |
 |
 |
0.0000000000025 |
0.000000092 |
0.000086 |
lowFe_KTKB_Day3 | 0.000862 | -0.547 |
| Title | Cluster Plot | Dendrogram | e-value | e-value | e-value | Condition | Condition FDR | Condition Difference |
|---|---|---|---|---|---|---|---|---|
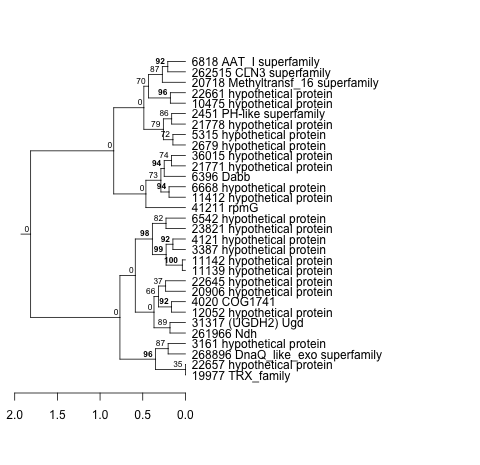
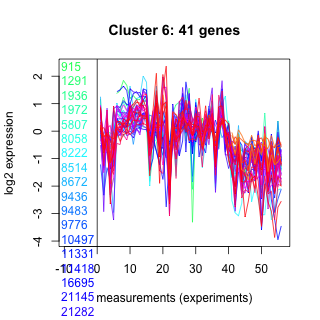
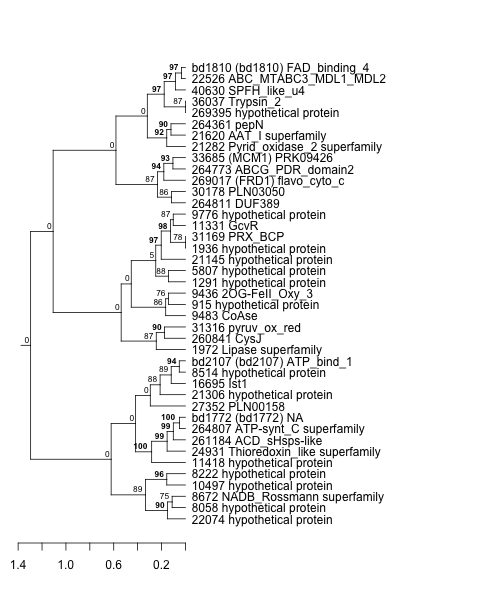
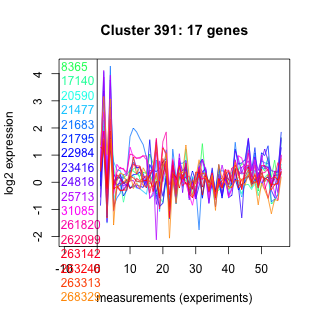
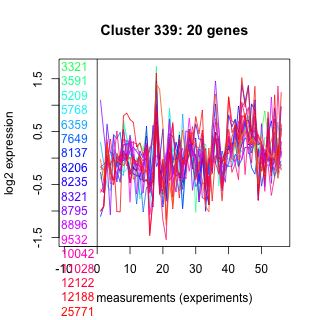
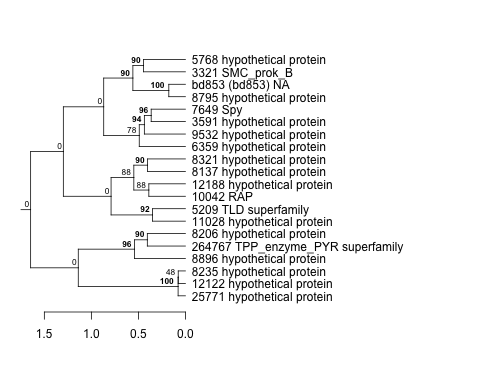
| Thaps_hclust_0391 |
 |
 |
1.9 |
34 |
32 |
lowN_TMEVA | 0.113000 | -0.546 |
| Title | Cluster Plot | Dendrogram | e-value | e-value | e-value | Condition | Condition FDR | Condition Difference |
|---|---|---|---|---|---|---|---|---|
| Thaps_hclust_0269 |
 |
 |
0.0025 |
0.032 |
0.077 |
BaP | 0.004310 | -0.546 |
| Title | Cluster Plot | Dendrogram | e-value | e-value | e-value | Condition | Condition FDR | Condition Difference |
|---|---|---|---|---|---|---|---|---|
| Thaps_hclust_0067 |
 |
 |
0.0036 |
0.86 |
0.11 |
lowN_TMEVA | 0.130000 | -0.546 |
| Title | Cluster Plot | Dendrogram | e-value | e-value | e-value | Condition | Condition FDR | Condition Difference |
|---|---|---|---|---|---|---|---|---|
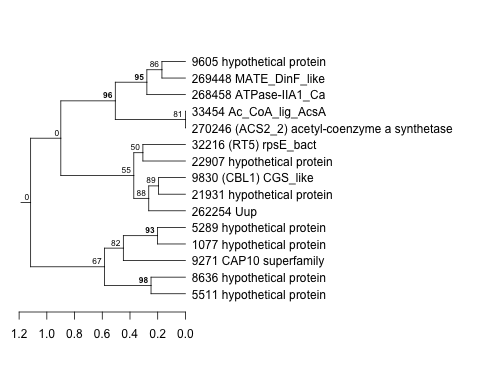
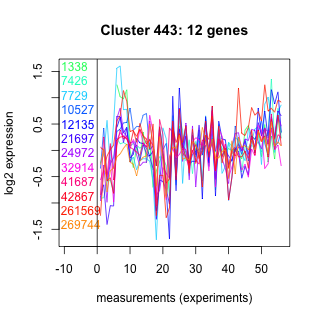
| Thaps_hclust_0443 |
 |
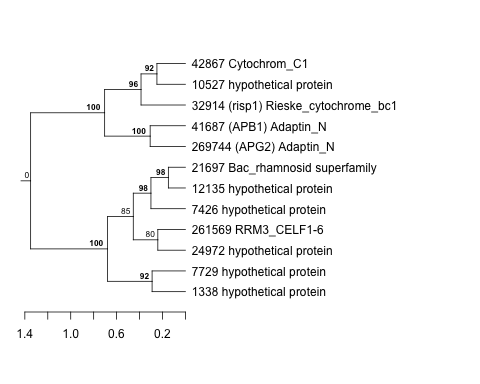 |
0.96 |
9.8 |
42 |
lowN_TMEVA | 0.179000 | -0.545 |
| Title | Cluster Plot | Dendrogram | e-value | e-value | e-value | Condition | Condition FDR | Condition Difference |
|---|---|---|---|---|---|---|---|---|
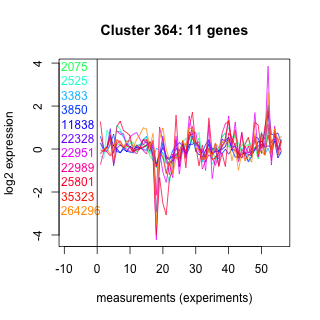
| Thaps_hclust_0364 |
 |
 |
4.5 |
28 |
590 |
diel_exponential_vs_stationary | 0.026900 | -0.545 |
| Title | Cluster Plot | Dendrogram | e-value | e-value | e-value | Condition | Condition FDR | Condition Difference |
|---|---|---|---|---|---|---|---|---|
| Thaps_hclust_0460 |
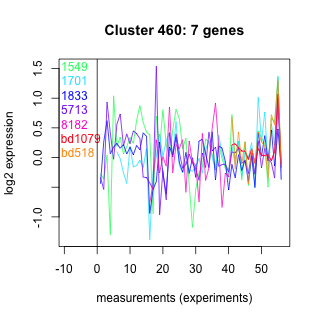 |
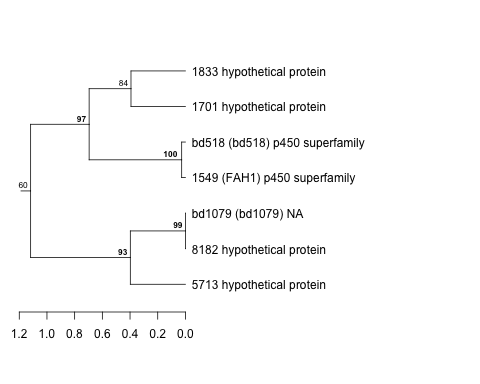 |
0.0073 |
0.0055 |
0.63 |
lowFe_KTKB_Day5 | 0.124000 | -0.544 |
| Title | Cluster Plot | Dendrogram | e-value | e-value | e-value | Condition | Condition FDR | Condition Difference |
|---|---|---|---|---|---|---|---|---|
| Thaps_hclust_0011 |
 |
 |
0.000023 |
10 |
1.3 |
lowFe_TMEVA | 0.040000 | -0.543 |
| Title | Cluster Plot | Dendrogram | e-value | e-value | e-value | Condition | Condition FDR | Condition Difference |
|---|---|---|---|---|---|---|---|---|
| Thaps_hclust_0191 |
 |
 |
1.5 |
3.5 |
44 |
co2_elevated_stat_arrays | 0.044700 | -0.542 |
| Title | Cluster Plot | Dendrogram | e-value | e-value | e-value | Condition | Condition FDR | Condition Difference |
|---|---|---|---|---|---|---|---|---|
| Thaps_hclust_0085 |
 |
 |
0.000012 |
0.0024 |
0.37 |
highlight_arrays | 0.000442 | -0.542 |
| Title | Cluster Plot | Dendrogram | e-value | e-value | e-value | Condition | Condition FDR | Condition Difference |
|---|---|---|---|---|---|---|---|---|
| Thaps_hclust_0496 |
 |
 |
0.00082 |
0.0031 |
0.43 |
co2_elevated_expo_arrays | 0.001390 | -0.54 |
| Title | Cluster Plot | Dendrogram | e-value | e-value | e-value | Condition | Condition FDR | Condition Difference |
|---|---|---|---|---|---|---|---|---|
| Thaps_hclust_0120 |
 |
 |
0.00000098 |
0.000000076 |
0.001 |
lowFe_KTKB_Day3 | 0.005630 | -0.54 |
| Title | Cluster Plot | Dendrogram | e-value | e-value | e-value | Condition | Condition FDR | Condition Difference |
|---|---|---|---|---|---|---|---|---|
| Thaps_hclust_0157 |
 |
 |
2 |
4.6 |
4.9 |
lowSi_TMEVA | 0.436000 | -0.54 |
| Title | Cluster Plot | Dendrogram | e-value | e-value | e-value | Condition | Condition FDR | Condition Difference |
|---|---|---|---|---|---|---|---|---|
| Thaps_hclust_0154 |
 |
 |
0.00015 |
0.0049 |
0.29 |
co2_elevated_stat_arrays | 0.004460 | -0.539 |
| Title | Cluster Plot | Dendrogram | e-value | e-value | e-value | Condition | Condition FDR | Condition Difference |
|---|---|---|---|---|---|---|---|---|
| Thaps_hclust_0090 |
 |
 |
0.23 |
2.7 |
11 |
BaP | 0.031100 | -0.539 |
| Title | Cluster Plot | Dendrogram | e-value | e-value | e-value | Condition | Condition FDR | Condition Difference |
|---|---|---|---|---|---|---|---|---|
| Thaps_hclust_0406 |
 |
 |
0.000039 |
0.013 |
0.13 |
lowFe_KTKB_Day3 | 0.000862 | -0.539 |
| Title | Cluster Plot | Dendrogram | e-value | e-value | e-value | Condition | Condition FDR | Condition Difference |
|---|---|---|---|---|---|---|---|---|
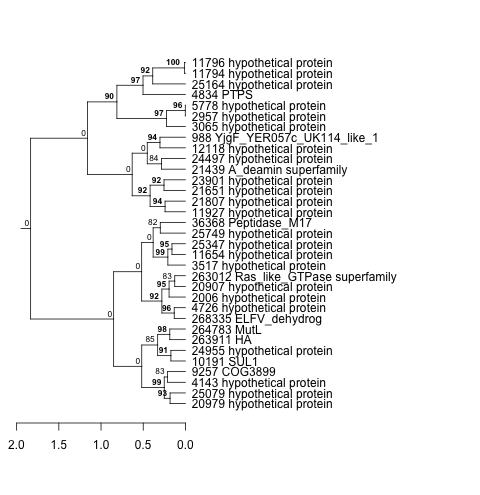
| Thaps_hclust_0297 |
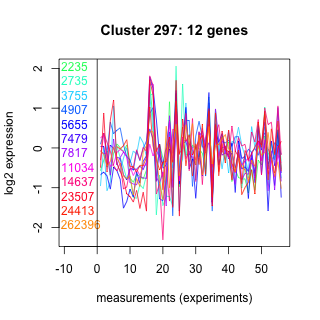 |
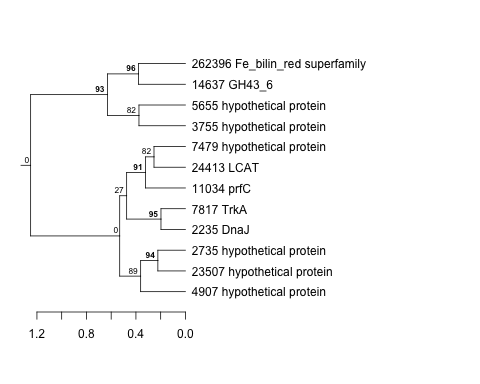 |
0.018 |
2.5 |
24 |
diel_light_vs_dark | 0.033500 | -0.539 |
| Title | Cluster Plot | Dendrogram | e-value | e-value | e-value | Condition | Condition FDR | Condition Difference |
|---|---|---|---|---|---|---|---|---|
| Thaps_hclust_0003 |
 |
 |
0.24 |
16 |
240 |
lowSi_TMEVA | 0.296000 | -0.538 |
| Title | Cluster Plot | Dendrogram | e-value | e-value | e-value | Condition | Condition FDR | Condition Difference |
|---|---|---|---|---|---|---|---|---|
| Thaps_hclust_0271 |
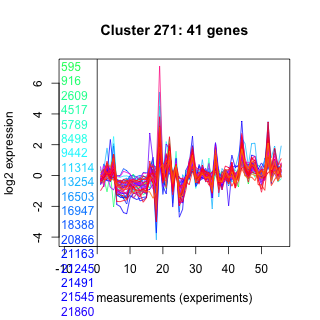 |
 |
Not available | Not available | Not available | exponential_vs_stationary_24light | 0.012300 | -0.538 |
| Title | Cluster Plot | Dendrogram | e-value | e-value | e-value | Condition | Condition FDR | Condition Difference |
|---|---|---|---|---|---|---|---|---|
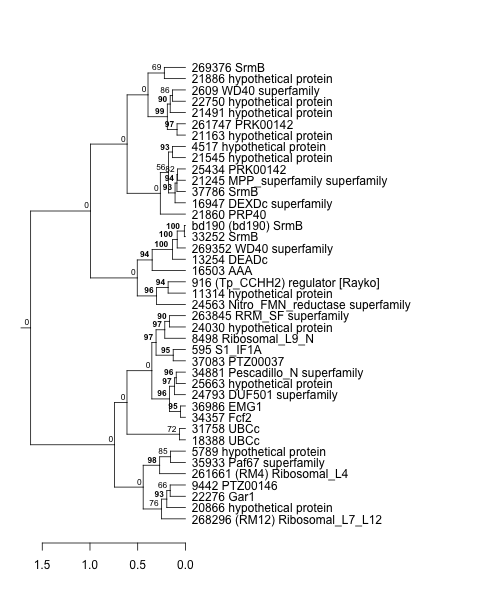
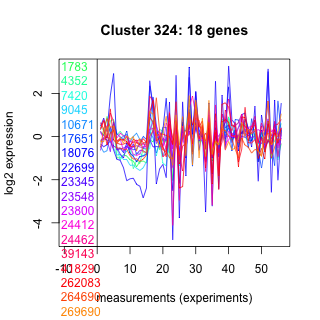
| Thaps_hclust_0324 |
 |
 |
0.0023 |
2.4 |
5.1 |
diel_exponential_vs_stationary | 0.004950 | -0.537 |
| Title | Cluster Plot | Dendrogram | e-value | e-value | e-value | Condition | Condition FDR | Condition Difference |
|---|---|---|---|---|---|---|---|---|
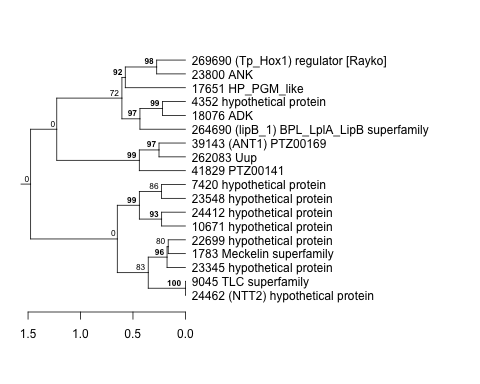
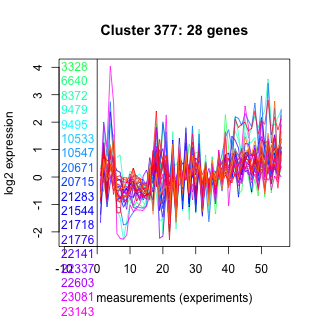
| Thaps_hclust_0377 |
 |
 |
0.00016 |
0.034 |
0.95 |
diel_exponential_vs_stationary | 0.000602 | -0.537 |
| Title | Cluster Plot | Dendrogram | e-value | e-value | e-value | Condition | Condition FDR | Condition Difference |
|---|---|---|---|---|---|---|---|---|
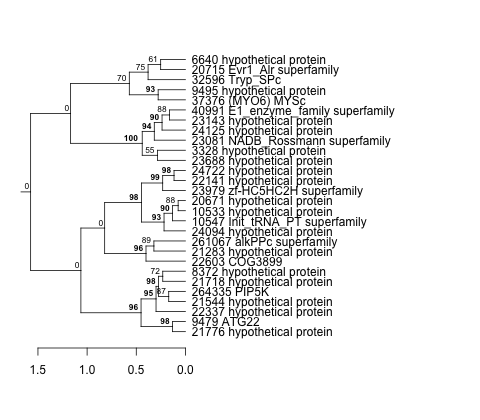
| Thaps_hclust_0479 |
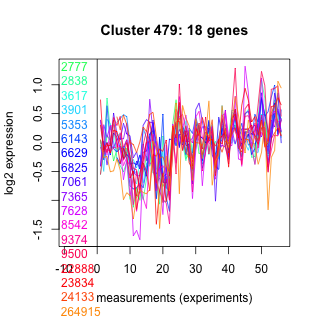 |
 |
0.11 |
0.2 |
1.5 |
BaP | 0.016400 | -0.537 |
| Title | Cluster Plot | Dendrogram | e-value | e-value | e-value | Condition | Condition FDR | Condition Difference |
|---|---|---|---|---|---|---|---|---|
| Thaps_hclust_0158 |
 |
 |
0.007 |
0.55 |
1.2 |
co2_elevated_stat_arrays | 0.017700 | -0.536 |
| Title | Cluster Plot | Dendrogram | e-value | e-value | e-value | Condition | Condition FDR | Condition Difference |
|---|---|---|---|---|---|---|---|---|
| Thaps_hclust_0286 |
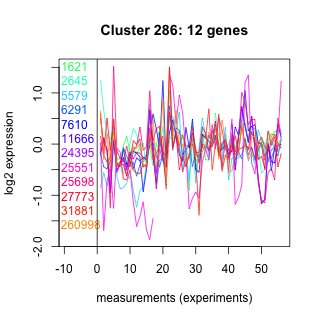 |
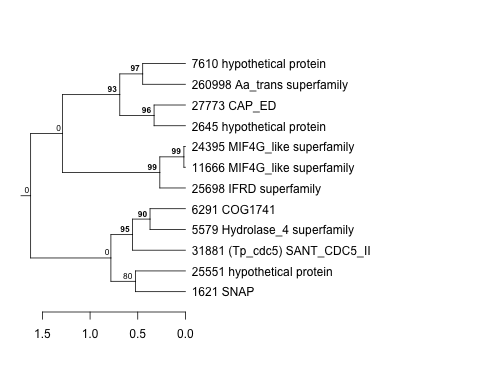 |
0.00008 |
0.0046 |
0.0058 |
lowSi_TMEVA | 0.389000 | -0.536 |
| Title | Cluster Plot | Dendrogram | e-value | e-value | e-value | Condition | Condition FDR | Condition Difference |
|---|---|---|---|---|---|---|---|---|
| Thaps_hclust_0498 |
 |
 |
1.3 |
1.8 |
1.8 |
exponential_vs_stationary_24light | 0.117000 | -0.535 |
| Title | Cluster Plot | Dendrogram | e-value | e-value | e-value | Condition | Condition FDR | Condition Difference |
|---|---|---|---|---|---|---|---|---|
| Thaps_hclust_0075 |
 |
 |
0.069 |
53 |
33 |
lowN_TMEVA | 0.187000 | -0.535 |
| Title | Cluster Plot | Dendrogram | e-value | e-value | e-value | Condition | Condition FDR | Condition Difference |
|---|---|---|---|---|---|---|---|---|
| Thaps_hclust_0362 |
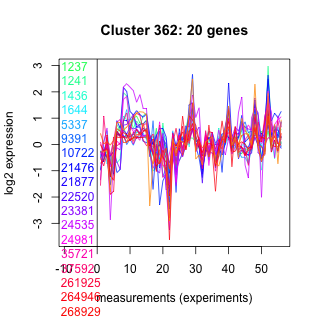 |
 |
0.00003 |
0.0033 |
0.66 |
lowtemp_TMEVA | 0.038200 | -0.535 |
| Title | Cluster Plot | Dendrogram | e-value | e-value | e-value | Condition | Condition FDR | Condition Difference |
|---|---|---|---|---|---|---|---|---|
| Thaps_hclust_0283 |
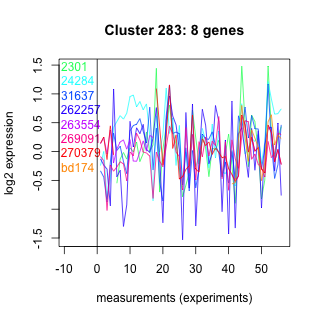 |
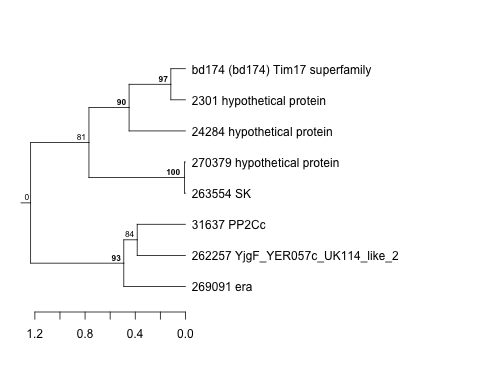 |
0.0022 |
0.0079 |
0.019 |
lowN_TMEVA | 0.261000 | -0.534 |
| Title | Cluster Plot | Dendrogram | e-value | e-value | e-value | Condition | Condition FDR | Condition Difference |
|---|---|---|---|---|---|---|---|---|
| Thaps_hclust_0335 |
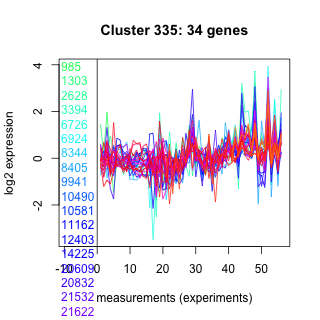 |
 |
0.0000000032 |
0.000001 |
0.019 |
diel_exponential_vs_stationary | 0.000602 | -0.534 |
| Title | Cluster Plot | Dendrogram | e-value | e-value | e-value | Condition | Condition FDR | Condition Difference |
|---|---|---|---|---|---|---|---|---|
| Thaps_hclust_0072 |
 |
 |
1.2e-22 |
1.1e-16 |
0.000000000000011 |
lowFe_KTKB_Day3 | 0.157000 | -0.534 |
| Title | Cluster Plot | Dendrogram | e-value | e-value | e-value | Condition | Condition FDR | Condition Difference |
|---|---|---|---|---|---|---|---|---|
| Thaps_hclust_0014 |
 |
 |
Not available | Not available | Not available | highlight_arrays | 0.000442 | -0.534 |
| Title | Cluster Plot | Dendrogram | e-value | e-value | e-value | Condition | Condition FDR | Condition Difference |
|---|---|---|---|---|---|---|---|---|
| Thaps_hclust_0389 |
 |
 |
0.00000008 |
0.00077 |
340 |
BaP | 0.005340 | -0.534 |
| Title | Cluster Plot | Dendrogram | e-value | e-value | e-value | Condition | Condition FDR | Condition Difference |
|---|---|---|---|---|---|---|---|---|
| Thaps_hclust_0337 |
 |
 |
3.5 |
3 |
280 |
exponential_vs_stationary_24highlight | 0.000526 | -0.534 |
| Title | Cluster Plot | Dendrogram | e-value | e-value | e-value | Condition | Condition FDR | Condition Difference |
|---|---|---|---|---|---|---|---|---|
| Thaps_hclust_0371 |
 |
 |
0.0051 |
0.11 |
1.1 |
lowN_TMEVA | 0.120000 | -0.533 |
| Title | Cluster Plot | Dendrogram | e-value | e-value | e-value | Condition | Condition FDR | Condition Difference |
|---|---|---|---|---|---|---|---|---|
| Thaps_hclust_0046 |
 |
 |
0.00000051 |
0.000067 |
0.29 |
diel_exponential_vs_stationary | 0.000602 | -0.532 |
| Title | Cluster Plot | Dendrogram | e-value | e-value | e-value | Condition | Condition FDR | Condition Difference |
|---|---|---|---|---|---|---|---|---|
| Thaps_hclust_0019 |
 |
 |
0.0000001 |
0.00000017 |
0.000037 |
BaP | 0.005590 | -0.532 |
| Title | Cluster Plot | Dendrogram | e-value | e-value | e-value | Condition | Condition FDR | Condition Difference |
|---|---|---|---|---|---|---|---|---|
| Thaps_hclust_0094 |
 |
 |
0.0000000025 |
0.000014 |
0.0000045 |
BaP | 0.000370 | -0.531 |
| Title | Cluster Plot | Dendrogram | e-value | e-value | e-value | Condition | Condition FDR | Condition Difference |
|---|---|---|---|---|---|---|---|---|
| Thaps_hclust_0039 |
 |
 |
2.2e-16 |
0.000000000000049 |
0.00083 |
lowSi_TMEVA | 0.074100 | -0.531 |
| Title | Cluster Plot | Dendrogram | e-value | e-value | e-value | Condition | Condition FDR | Condition Difference |
|---|---|---|---|---|---|---|---|---|
| Thaps_hclust_0412 |
 |
 |
0.39 |
17 |
2.9 |
co2_elevated_stat_arrays | 0.037800 | -0.531 |
| Title | Cluster Plot | Dendrogram | e-value | e-value | e-value | Condition | Condition FDR | Condition Difference |
|---|---|---|---|---|---|---|---|---|
| Thaps_hclust_0065 |
 |
 |
1.5e-32 |
2.5e-32 |
9.9e-33 |
lowFe_TMEVA | 0.002940 | -0.531 |
| Title | Cluster Plot | Dendrogram | e-value | e-value | e-value | Condition | Condition FDR | Condition Difference |
|---|---|---|---|---|---|---|---|---|
| Thaps_hclust_0155 |
 |
 |
0.32 |
5.4 |
2 |
co2_elevated_stat_arrays | 0.052200 | -0.53 |
| Title | Cluster Plot | Dendrogram | e-value | e-value | e-value | Condition | Condition FDR | Condition Difference |
|---|---|---|---|---|---|---|---|---|
| Thaps_hclust_0372 |
 |
 |
0.0016 |
0.064 |
18 |
lowN_TMEVA | 0.122000 | -0.53 |
| Title | Cluster Plot | Dendrogram | e-value | e-value | e-value | Condition | Condition FDR | Condition Difference |
|---|---|---|---|---|---|---|---|---|
| Thaps_hclust_0424 |
 |
 |
0.012 |
0.74 |
0.26 |
diel_light_vs_dark | 0.000485 | -0.53 |
| Title | Cluster Plot | Dendrogram | e-value | e-value | e-value | Condition | Condition FDR | Condition Difference |
|---|---|---|---|---|---|---|---|---|
| Thaps_hclust_0101 |
 |
 |
0.000000016 |
0.0000038 |
0.014 |
lowFe_TMEVA | 0.003700 | -0.529 |
| Title | Cluster Plot | Dendrogram | e-value | e-value | e-value | Condition | Condition FDR | Condition Difference |
|---|---|---|---|---|---|---|---|---|
| Thaps_hclust_0304 |
 |
 |
0.16 |
1.3 |
16 |
exponential_vs_stationary_24light | 0.023800 | -0.529 |
| Title | Cluster Plot | Dendrogram | e-value | e-value | e-value | Condition | Condition FDR | Condition Difference |
|---|---|---|---|---|---|---|---|---|
| Thaps_hclust_0213 |
 |
 |
0.0000045 |
0.075 |
0.54 |
lowtemp_TMEVA | 0.002080 | -0.529 |
| Title | Cluster Plot | Dendrogram | e-value | e-value | e-value | Condition | Condition FDR | Condition Difference |
|---|---|---|---|---|---|---|---|---|
| Thaps_hclust_0079 |
 |
 |
0.00048 |
0.000048 |
0.27 |
highpH_TMEVA | 0.000725 | -0.528 |
| Title | Cluster Plot | Dendrogram | e-value | e-value | e-value | Condition | Condition FDR | Condition Difference |
|---|---|---|---|---|---|---|---|---|
| Thaps_hclust_0488 |
 |
 |
0.15 |
0.012 |
0.2 |
diel_light_vs_dark | 0.001360 | -0.527 |
| Title | Cluster Plot | Dendrogram | e-value | e-value | e-value | Condition | Condition FDR | Condition Difference |
|---|---|---|---|---|---|---|---|---|
| Thaps_hclust_0058 |
 |
 |
0.000000037 |
0.000000014 |
0.00000069 |
lowN_TMEVA | 0.013600 | -0.527 |
| Title | Cluster Plot | Dendrogram | e-value | e-value | e-value | Condition | Condition FDR | Condition Difference |
|---|---|---|---|---|---|---|---|---|
| Thaps_hclust_0500 |
 |
 |
0.91 |
14 |
30 |
lowFe_KTKB_Day5 | 0.012300 | -0.527 |
| Title | Cluster Plot | Dendrogram | e-value | e-value | e-value | Condition | Condition FDR | Condition Difference |
|---|---|---|---|---|---|---|---|---|
| Thaps_hclust_0173 |
 |
 |
0.013 |
0.83 |
0.45 |
co2_elevated_stat_arrays | 0.005610 | -0.526 |
| Title | Cluster Plot | Dendrogram | e-value | e-value | e-value | Condition | Condition FDR | Condition Difference |
|---|---|---|---|---|---|---|---|---|
| Thaps_hclust_0052 |
 |
 |
1.4e-22 |
3.3e-19 |
0.0000000000037 |
lowSi_TMEVA | 0.091400 | -0.526 |
| Title | Cluster Plot | Dendrogram | e-value | e-value | e-value | Condition | Condition FDR | Condition Difference |
|---|---|---|---|---|---|---|---|---|
| Thaps_hclust_0415 |
 |
 |
0.0000000000041 |
0.000000046 |
0.000024 |
diel_exponential_vs_stationary | 0.000602 | -0.526 |
| Title | Cluster Plot | Dendrogram | e-value | e-value | e-value | Condition | Condition FDR | Condition Difference |
|---|---|---|---|---|---|---|---|---|
| Thaps_hclust_0252 |
 |
 |
0.000053 |
0.0057 |
2.1 |
lowN_TMEVA | 0.047600 | -0.525 |
| Title | Cluster Plot | Dendrogram | e-value | e-value | e-value | Condition | Condition FDR | Condition Difference |
|---|---|---|---|---|---|---|---|---|
| Thaps_hclust_0201 |
 |
 |
0.11 |
7.6 |
12 |
lowFe_TMEVA | 0.223000 | -0.525 |
| Title | Cluster Plot | Dendrogram | e-value | e-value | e-value | Condition | Condition FDR | Condition Difference |
|---|---|---|---|---|---|---|---|---|
| Thaps_hclust_0057 |
 |
 |
1.5 |
1.7 |
12 |
co2_elevated_stat_arrays | 0.053100 | -0.525 |
| Title | Cluster Plot | Dendrogram | e-value | e-value | e-value | Condition | Condition FDR | Condition Difference |
|---|---|---|---|---|---|---|---|---|
| Thaps_hclust_0159 |
 |
 |
0.087 |
1.3 |
3 |
highpH_TMEVA | 0.008100 | -0.524 |
| Title | Cluster Plot | Dendrogram | e-value | e-value | e-value | Condition | Condition FDR | Condition Difference |
|---|---|---|---|---|---|---|---|---|
| Thaps_hclust_0463 |
 |
 |
0.0000000063 |
0.000000075 |
0.78 |
BaP | 0.001910 | -0.524 |
| Title | Cluster Plot | Dendrogram | e-value | e-value | e-value | Condition | Condition FDR | Condition Difference |
|---|---|---|---|---|---|---|---|---|
| Thaps_hclust_0339 |
 |
 |
0.000016 |
0.00038 |
0.0017 |
lowFe_KTKB_Day3 | 0.016500 | -0.524 |
| Title | Cluster Plot | Dendrogram | e-value | e-value | e-value | Condition | Condition FDR | Condition Difference |
|---|---|---|---|---|---|---|---|---|
| Thaps_hclust_0399 |
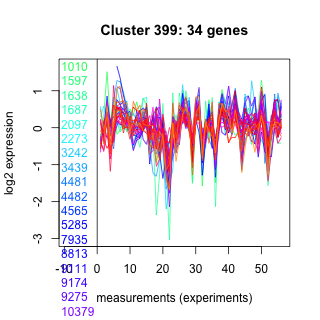 |
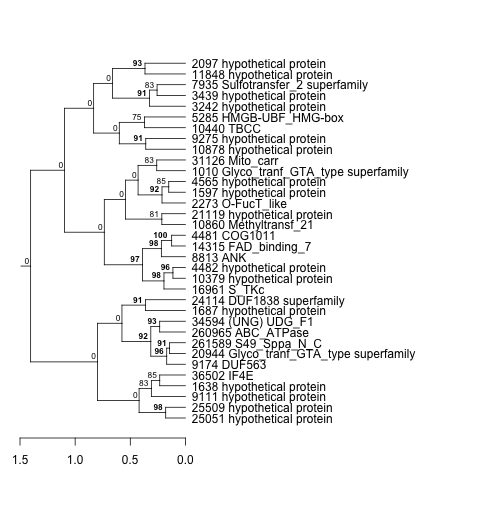 |
0.0039 |
0.16 |
0.0016 |
co2_elevated_stat_arrays | 0.001190 | -0.523 |
| Title | Cluster Plot | Dendrogram | e-value | e-value | e-value | Condition | Condition FDR | Condition Difference |
|---|---|---|---|---|---|---|---|---|
| Thaps_hclust_0402 |
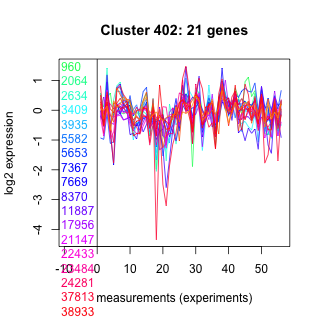 |
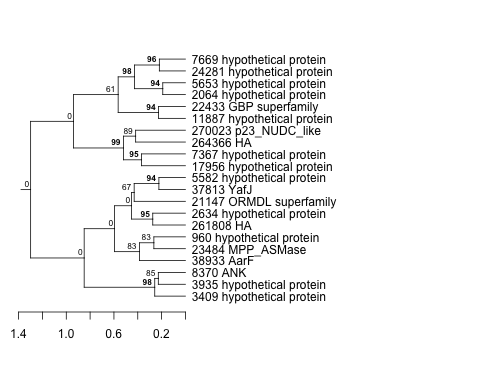 |
0.0022 |
5.7 |
0.07 |
exponential_vs_stationary_24light | 0.083200 | -0.523 |
| Title | Cluster Plot | Dendrogram | e-value | e-value | e-value | Condition | Condition FDR | Condition Difference |
|---|---|---|---|---|---|---|---|---|
| Thaps_hclust_0309 |
 |
 |
0.0000055 |
0.015 |
1.1 |
exponential_vs_stationary_24highlight | 0.000526 | -0.523 |
| Title | Cluster Plot | Dendrogram | e-value | e-value | e-value | Condition | Condition FDR | Condition Difference |
|---|---|---|---|---|---|---|---|---|
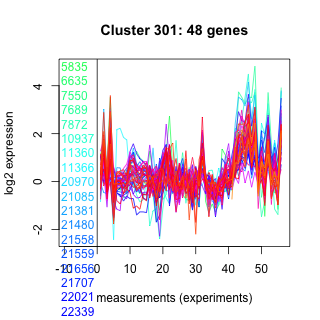
| Thaps_hclust_0301 |
 |
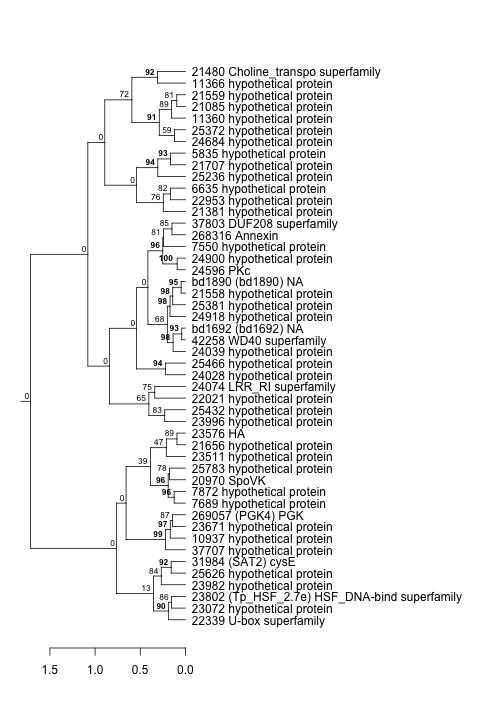 |
0.000000022 |
0.82 |
2.1 |
lowtemp_TMEVA | 0.004380 | -0.522 |
| Title | Cluster Plot | Dendrogram | e-value | e-value | e-value | Condition | Condition FDR | Condition Difference |
|---|---|---|---|---|---|---|---|---|
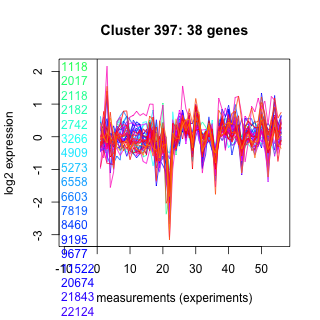
| Thaps_hclust_0397 |
 |
 |
0.00003 |
0.00016 |
0.0062 |
co2_elevated_stat_arrays | 0.000658 | -0.522 |
| Title | Cluster Plot | Dendrogram | e-value | e-value | e-value | Condition | Condition FDR | Condition Difference |
|---|---|---|---|---|---|---|---|---|
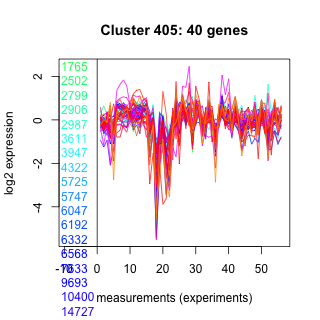
| Thaps_hclust_0405 |
 |
 |
0.00000000036 |
0.0000000063 |
0.005 |
lowtemp_TMEVA | 0.003800 | -0.521 |