Hierarchical Clusters
Displaying 101 - 200 of 7500
| Title | Cluster Plot | Dendrogram | e-value | e-value | e-value | Condition | Condition FDR | Condition Difference |
|---|---|---|---|---|---|---|---|---|
| Thaps_hclust_0220 |
 |
|
|
2.4e-19 |
3.2e-19 |
co2_elevated_expo_arrays | 0.021800 | -0.173 |
| Thaps_hclust_0220 |
|
|
|
2.4e-19 |
3.2e-19 |
lowFe_TMEVA | 0.452000 | -0.154 |
| Thaps_hclust_0220 |
|
|
|
2.4e-19 |
3.2e-19 |
exponential_vs_stationary_24light | 0.000581 | -1.02 |
| Thaps_hclust_0220 |
|
|
|
2.4e-19 |
3.2e-19 |
lowN_TMEVA | 0.001190 | 0.851 |
| Thaps_hclust_0220 |
|
|
|
2.4e-19 |
3.2e-19 |
diel_exponential_vs_stationary | 0.000602 | -0.271 |
| Thaps_hclust_0220 |
|
|
|
2.4e-19 |
3.2e-19 |
lowSi_TMEVA | 1.000000 | 0.0311 |
| Thaps_hclust_0220 |
|
|
|
2.4e-19 |
3.2e-19 |
highlight_arrays | 0.000442 | 0.336 |
| Title | Cluster Plot | Dendrogram | e-value | e-value | e-value | Condition | Condition FDR | Condition Difference |
|---|---|---|---|---|---|---|---|---|
| Thaps_hclust_0221 |
 |
|
|
1e-37 |
0.0000000000012 |
lowFe_TMEVA | 0.888000 | -0.0579 |
| Thaps_hclust_0221 |
|
|
|
1e-37 |
0.0000000000012 |
exponential_vs_stationary_24light | 0.000581 | -0.638 |
| Thaps_hclust_0221 |
|
|
|
1e-37 |
0.0000000000012 |
lowN_TMEVA | 0.001190 | 0.702 |
| Thaps_hclust_0221 |
|
|
|
1e-37 |
0.0000000000012 |
diel_exponential_vs_stationary | 0.004250 | -0.226 |
| Thaps_hclust_0221 |
|
|
|
1e-37 |
0.0000000000012 |
lowSi_TMEVA | 1.000000 | -0.0344 |
| Thaps_hclust_0221 |
|
|
|
1e-37 |
0.0000000000012 |
highlight_arrays | 0.173000 | 0.117 |
| Title | Cluster Plot | Dendrogram | e-value | e-value | e-value | Condition | Condition FDR | Condition Difference |
|---|---|---|---|---|---|---|---|---|
| Thaps_hclust_0230 |
 |
|
|
1.1e-30 |
0.0000000000029 |
lowFe_KTKB_Day3 | 0.200000 | 0.124 |
| Thaps_hclust_0230 |
|
|
|
1.1e-30 |
0.0000000000029 |
lowFe_KTKB_Day5 | 0.964000 | 0.00449 |
| Thaps_hclust_0230 |
|
|
|
1.1e-30 |
0.0000000000029 |
BaP | 0.000370 | 0.702 |
| Thaps_hclust_0230 |
|
|
|
1.1e-30 |
0.0000000000029 |
exponential_vs_stationary_24highlight | 0.000526 | -0.223 |
| Thaps_hclust_0230 |
|
|
|
1.1e-30 |
0.0000000000029 |
co2_elevated_stat_arrays | 0.000658 | 0.639 |
| Thaps_hclust_0230 |
|
|
|
1.1e-30 |
0.0000000000029 |
lowtemp_TMEVA | 0.000735 | 0.532 |
| Thaps_hclust_0230 |
|
|
|
1.1e-30 |
0.0000000000029 |
highpH_TMEVA | 0.000725 | -0.249 |
| Title | Cluster Plot | Dendrogram | e-value | e-value | e-value | Condition | Condition FDR | Condition Difference |
|---|---|---|---|---|---|---|---|---|
| Thaps_hclust_0082 |
 |
|
8.89825e-43 |
2e-27 |
1.3e-16 |
lowFe_KTKB_Day5 | 0.001320 | 0.728 |
| Thaps_hclust_0082 |
|
|
8.89825e-43 |
2e-27 |
1.3e-16 |
BaP | 0.824000 | -0.0268 |
| Thaps_hclust_0082 |
|
|
8.89825e-43 |
2e-27 |
1.3e-16 |
exponential_vs_stationary_24highlight | 0.000526 | 0.226 |
| Thaps_hclust_0082 |
|
|
8.89825e-43 |
2e-27 |
1.3e-16 |
co2_elevated_stat_arrays | 0.046800 | 0.253 |
| Thaps_hclust_0082 |
|
|
8.89825e-43 |
2e-27 |
1.3e-16 |
lowtemp_TMEVA | 1.000000 | -0.000692 |
| Thaps_hclust_0082 |
|
|
8.89825e-43 |
2e-27 |
1.3e-16 |
highpH_TMEVA | 0.000725 | -0.879 |
| Thaps_hclust_0082 |
|
|
8.89825e-43 |
2e-27 |
1.3e-16 |
co2_elevated_expo_arrays | 0.001390 | 1.09 |
| Thaps_hclust_0082 |
|
|
8.89825e-43 |
2e-27 |
1.3e-16 |
lowFe_TMEVA | 0.452000 | 0.152 |
| Thaps_hclust_0082 |
|
|
8.89825e-43 |
2e-27 |
1.3e-16 |
exponential_vs_stationary_24light | 0.000581 | 2.11 |
| Thaps_hclust_0082 |
|
|
8.89825e-43 |
2e-27 |
1.3e-16 |
lowN_TMEVA | 0.001190 | -0.512 |
| Thaps_hclust_0082 |
|
|
8.89825e-43 |
2e-27 |
1.3e-16 |
diel_exponential_vs_stationary | 0.170000 | 0.116 |
| Thaps_hclust_0082 |
|
|
8.89825e-43 |
2e-27 |
1.3e-16 |
lowSi_TMEVA | 0.001350 | -1.03 |
| Thaps_hclust_0082 |
|
|
8.89825e-43 |
2e-27 |
1.3e-16 |
highlight_arrays | 0.000442 | -0.807 |
| Thaps_hclust_0082 |
|
|
8.89825e-43 |
2e-27 |
1.3e-16 |
diel_light_vs_dark | 0.000485 | 1.67 |
| Thaps_hclust_0082 |
|
|
8.89825e-43 |
2e-27 |
1.3e-16 |
lowFe_KTKB_Day3 | 0.000862 | 0.987 |
| Title | Cluster Plot | Dendrogram | e-value | e-value | e-value | Condition | Condition FDR | Condition Difference |
|---|---|---|---|---|---|---|---|---|
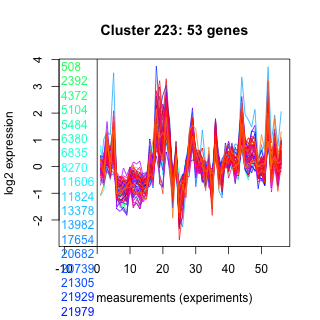
| Thaps_hclust_0223 |
 |
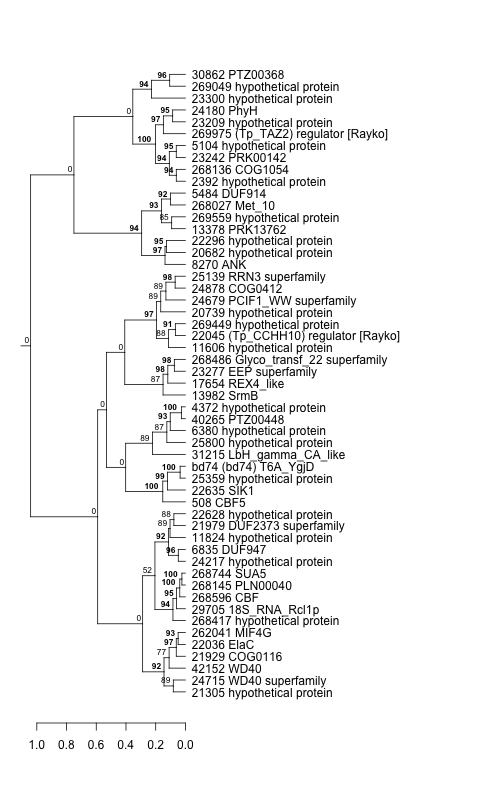 |
1.70006e-41 |
0.000000000000099 |
0.0011 |
lowFe_KTKB_Day5 | 0.699000 | -0.0544 |
| Thaps_hclust_0223 |
|
|
1.70006e-41 |
0.000000000000099 |
0.0011 |
BaP | 0.000370 | 1.36 |
| Thaps_hclust_0223 |
|
|
1.70006e-41 |
0.000000000000099 |
0.0011 |
exponential_vs_stationary_24highlight | 0.000526 | -0.22 |
| Thaps_hclust_0223 |
|
|
1.70006e-41 |
0.000000000000099 |
0.0011 |
co2_elevated_stat_arrays | 0.000658 | 0.847 |
| Thaps_hclust_0223 |
|
|
1.70006e-41 |
0.000000000000099 |
0.0011 |
lowtemp_TMEVA | 0.000735 | 0.902 |
| Thaps_hclust_0223 |
|
|
1.70006e-41 |
0.000000000000099 |
0.0011 |
highpH_TMEVA | 0.450000 | -0.0907 |
| Thaps_hclust_0223 |
|
|
1.70006e-41 |
0.000000000000099 |
0.0011 |
co2_elevated_expo_arrays | 0.991000 | -0.00671 |
| Thaps_hclust_0223 |
|
|
1.70006e-41 |
0.000000000000099 |
0.0011 |
lowFe_TMEVA | 0.857000 | -0.0669 |
| Thaps_hclust_0223 |
|
|
1.70006e-41 |
0.000000000000099 |
0.0011 |
exponential_vs_stationary_24light | 0.000581 | -0.92 |
| Thaps_hclust_0223 |
|
|
1.70006e-41 |
0.000000000000099 |
0.0011 |
lowN_TMEVA | 0.001190 | 0.611 |
| Thaps_hclust_0223 |
|
|
1.70006e-41 |
0.000000000000099 |
0.0011 |
diel_exponential_vs_stationary | 0.000602 | -0.401 |
| Thaps_hclust_0223 |
|
|
1.70006e-41 |
0.000000000000099 |
0.0011 |
lowSi_TMEVA | 1.000000 | 0.0777 |
| Thaps_hclust_0223 |
|
|
1.70006e-41 |
0.000000000000099 |
0.0011 |
highlight_arrays | 0.038400 | 0.205 |
| Thaps_hclust_0223 |
|
|
1.70006e-41 |
0.000000000000099 |
0.0011 |
diel_light_vs_dark | 0.000485 | -0.387 |
| Thaps_hclust_0223 |
|
|
1.70006e-41 |
0.000000000000099 |
0.0011 |
lowFe_KTKB_Day3 | 0.974000 | 0.0067 |
| Title | Cluster Plot | Dendrogram | e-value | e-value | e-value | Condition | Condition FDR | Condition Difference |
|---|---|---|---|---|---|---|---|---|
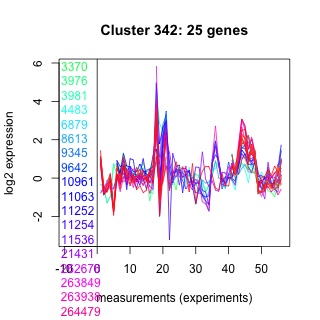
| Thaps_hclust_0342 |
 |
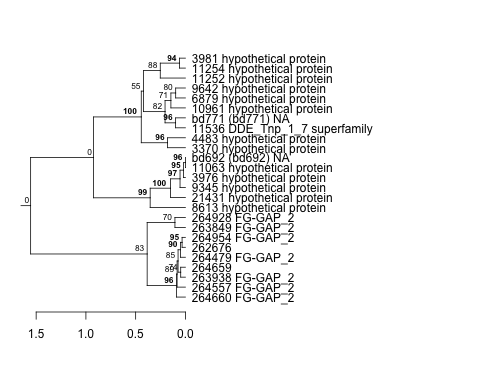 |
5.79997e-41 |
2.7e-33 |
3.1e-31 |
lowN_TMEVA | 0.026800 | -0.609 |
| Thaps_hclust_0342 |
|
|
5.79997e-41 |
2.7e-33 |
3.1e-31 |
diel_exponential_vs_stationary | 0.639000 | 0.0897 |
| Thaps_hclust_0342 |
|
|
5.79997e-41 |
2.7e-33 |
3.1e-31 |
lowSi_TMEVA | 0.832000 | -0.226 |
| Thaps_hclust_0342 |
|
|
5.79997e-41 |
2.7e-33 |
3.1e-31 |
highlight_arrays | 0.000442 | 1.21 |
| Thaps_hclust_0342 |
|
|
5.79997e-41 |
2.7e-33 |
3.1e-31 |
diel_light_vs_dark | 0.902000 | 0.0393 |
| Thaps_hclust_0342 |
|
|
5.79997e-41 |
2.7e-33 |
3.1e-31 |
lowFe_KTKB_Day3 | 0.909000 | -0.0352 |
| Thaps_hclust_0342 |
|
|
5.79997e-41 |
2.7e-33 |
3.1e-31 |
lowFe_KTKB_Day5 | 0.774000 | 0.0606 |
| Thaps_hclust_0342 |
|
|
5.79997e-41 |
2.7e-33 |
3.1e-31 |
BaP | 0.000370 | 1.63 |
| Thaps_hclust_0342 |
|
|
5.79997e-41 |
2.7e-33 |
3.1e-31 |
exponential_vs_stationary_24highlight | 0.740000 | 0.0358 |
| Thaps_hclust_0342 |
|
|
5.79997e-41 |
2.7e-33 |
3.1e-31 |
co2_elevated_stat_arrays | 0.000658 | 0.634 |
| Thaps_hclust_0342 |
|
|
5.79997e-41 |
2.7e-33 |
3.1e-31 |
lowtemp_TMEVA | 0.000735 | -1.13 |
| Thaps_hclust_0342 |
|
|
5.79997e-41 |
2.7e-33 |
3.1e-31 |
highpH_TMEVA | 0.000725 | 0.548 |
| Thaps_hclust_0342 |
|
|
5.79997e-41 |
2.7e-33 |
3.1e-31 |
co2_elevated_expo_arrays | 0.748000 | 0.0884 |
| Thaps_hclust_0342 |
|
|
5.79997e-41 |
2.7e-33 |
3.1e-31 |
lowFe_TMEVA | 0.001040 | -0.647 |
| Thaps_hclust_0342 |
|
|
5.79997e-41 |
2.7e-33 |
3.1e-31 |
exponential_vs_stationary_24light | 0.457000 | -0.234 |
| Title | Cluster Plot | Dendrogram | e-value | e-value | e-value | Condition | Condition FDR | Condition Difference |
|---|---|---|---|---|---|---|---|---|
| Thaps_hclust_0041 |
 |
 |
4.4e-38 |
0.000000011 |
0.0000042 |
lowN_TMEVA | 0.515000 | -0.194 |
| Thaps_hclust_0041 |
|
|
4.4e-38 |
0.000000011 |
0.0000042 |
diel_exponential_vs_stationary | 0.976000 | 0.00591 |
| Thaps_hclust_0041 |
|
|
4.4e-38 |
0.000000011 |
0.0000042 |
lowSi_TMEVA | 0.976000 | -0.149 |
| Thaps_hclust_0041 |
|
|
4.4e-38 |
0.000000011 |
0.0000042 |
highlight_arrays | 0.028100 | -0.217 |
| Thaps_hclust_0041 |
|
|
4.4e-38 |
0.000000011 |
0.0000042 |
diel_light_vs_dark | 0.000485 | -1.94 |
| Thaps_hclust_0041 |
|
|
4.4e-38 |
0.000000011 |
0.0000042 |
lowFe_KTKB_Day3 | 0.000862 | 0.583 |
| Thaps_hclust_0041 |
|
|
4.4e-38 |
0.000000011 |
0.0000042 |
lowFe_KTKB_Day5 | 0.001320 | 0.454 |
| Thaps_hclust_0041 |
|
|
4.4e-38 |
0.000000011 |
0.0000042 |
BaP | 0.856000 | -0.031 |
| Thaps_hclust_0041 |
|
|
4.4e-38 |
0.000000011 |
0.0000042 |
exponential_vs_stationary_24highlight | 0.009860 | 0.158 |
| Thaps_hclust_0041 |
|
|
4.4e-38 |
0.000000011 |
0.0000042 |
co2_elevated_stat_arrays | 0.113000 | 0.258 |
| Thaps_hclust_0041 |
|
|
4.4e-38 |
0.000000011 |
0.0000042 |
lowtemp_TMEVA | 0.000735 | 0.575 |
| Thaps_hclust_0041 |
|
|
4.4e-38 |
0.000000011 |
0.0000042 |
highpH_TMEVA | 0.680000 | 0.0558 |
| Thaps_hclust_0041 |
|
|
4.4e-38 |
0.000000011 |
0.0000042 |
co2_elevated_expo_arrays | 0.068700 | 0.178 |
| Thaps_hclust_0041 |
|
|
4.4e-38 |
0.000000011 |
0.0000042 |
lowFe_TMEVA | 0.951000 | -0.0295 |
| Thaps_hclust_0041 |
|
|
4.4e-38 |
0.000000011 |
0.0000042 |
exponential_vs_stationary_24light | 0.343000 | 0.223 |
| Title | Cluster Plot | Dendrogram | e-value | e-value | e-value | Condition | Condition FDR | Condition Difference |
|---|---|---|---|---|---|---|---|---|
| Thaps_hclust_0092 |
 |
|
1.3e-37 |
4.2e-20 |
0.0000000000000013 |
lowtemp_TMEVA | 0.038100 | -0.246 |
| Thaps_hclust_0092 |
|
|
1.3e-37 |
4.2e-20 |
0.0000000000000013 |
highpH_TMEVA | 0.000725 | -0.895 |
| Thaps_hclust_0092 |
|
|
1.3e-37 |
4.2e-20 |
0.0000000000000013 |
co2_elevated_expo_arrays | 0.001390 | 1.11 |
| Thaps_hclust_0092 |
|
|
1.3e-37 |
4.2e-20 |
0.0000000000000013 |
lowFe_TMEVA | 0.766000 | 0.0993 |
| Thaps_hclust_0092 |
|
|
1.3e-37 |
4.2e-20 |
0.0000000000000013 |
exponential_vs_stationary_24light | 0.000581 | 1.99 |
| Thaps_hclust_0092 |
|
|
1.3e-37 |
4.2e-20 |
0.0000000000000013 |
lowN_TMEVA | 0.001190 | -0.464 |
| Thaps_hclust_0092 |
|
|
1.3e-37 |
4.2e-20 |
0.0000000000000013 |
diel_exponential_vs_stationary | 0.043600 | 0.159 |
| Thaps_hclust_0092 |
|
|
1.3e-37 |
4.2e-20 |
0.0000000000000013 |
lowSi_TMEVA | 0.001350 | -1.05 |
| Thaps_hclust_0092 |
|
|
1.3e-37 |
4.2e-20 |
0.0000000000000013 |
highlight_arrays | 0.000442 | -0.346 |
| Thaps_hclust_0092 |
|
|
1.3e-37 |
4.2e-20 |
0.0000000000000013 |
diel_light_vs_dark | 0.000485 | 1.49 |
| Thaps_hclust_0092 |
|
|
1.3e-37 |
4.2e-20 |
0.0000000000000013 |
lowFe_KTKB_Day3 | 0.000862 | 0.577 |
| Thaps_hclust_0092 |
|
|
1.3e-37 |
4.2e-20 |
0.0000000000000013 |
lowFe_KTKB_Day5 | 0.001320 | 0.343 |
| Thaps_hclust_0092 |
|
|
1.3e-37 |
4.2e-20 |
0.0000000000000013 |
BaP | 0.537000 | -0.0686 |
| Thaps_hclust_0092 |
|
|
1.3e-37 |
4.2e-20 |
0.0000000000000013 |
exponential_vs_stationary_24highlight | 0.722000 | -0.0199 |
| Thaps_hclust_0092 |
|
|
1.3e-37 |
4.2e-20 |
0.0000000000000013 |
co2_elevated_stat_arrays | 0.000658 | 1.24 |
| Title | Cluster Plot | Dendrogram | e-value | e-value | e-value | Condition | Condition FDR | Condition Difference |
|---|---|---|---|---|---|---|---|---|
| Thaps_hclust_0260 |
 |
 |
1.6e-36 |
9.1e-22 |
8.6e-22 |
lowFe_KTKB_Day3 | 0.315000 | -0.323 |
| Thaps_hclust_0260 |
|
|
1.6e-36 |
9.1e-22 |
8.6e-22 |
lowFe_KTKB_Day5 | 0.284000 | -0.287 |
| Thaps_hclust_0260 |
|
|
1.6e-36 |
9.1e-22 |
8.6e-22 |
BaP | 0.087500 | 0.487 |
| Thaps_hclust_0260 |
|
|
1.6e-36 |
9.1e-22 |
8.6e-22 |
exponential_vs_stationary_24highlight | 0.000926 | 0.541 |
| Thaps_hclust_0260 |
|
|
1.6e-36 |
9.1e-22 |
8.6e-22 |
co2_elevated_stat_arrays | 0.011200 | 0.673 |