Hierarchical Clusters
Displaying 1601 - 1700 of 7500
| Title | Cluster Plot | Dendrogram | e-value | e-value | e-value | Condition | Condition FDR | Condition Difference |
|---|---|---|---|---|---|---|---|---|
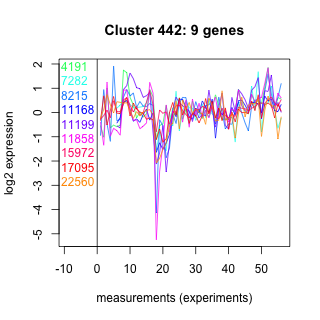
| Thaps_hclust_0442 |
 |
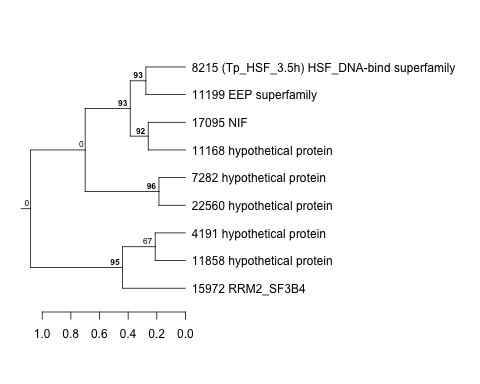 |
0.045 |
2.3 |
2.8 |
BaP | 0.000370 | -1.3 |
| Thaps_hclust_0442 |
|
|
0.045 |
2.3 |
2.8 |
exponential_vs_stationary_24highlight | 0.240000 | 0.187 |
| Thaps_hclust_0442 |
|
|
0.045 |
2.3 |
2.8 |
co2_elevated_stat_arrays | 0.051300 | 0.573 |
| Title | Cluster Plot | Dendrogram | e-value | e-value | e-value | Condition | Condition FDR | Condition Difference |
|---|---|---|---|---|---|---|---|---|
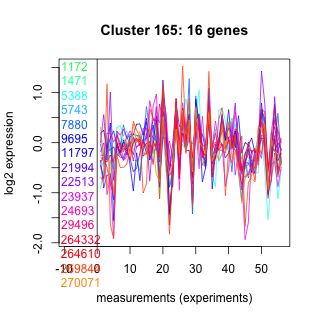
| Thaps_hclust_0165 |
 |
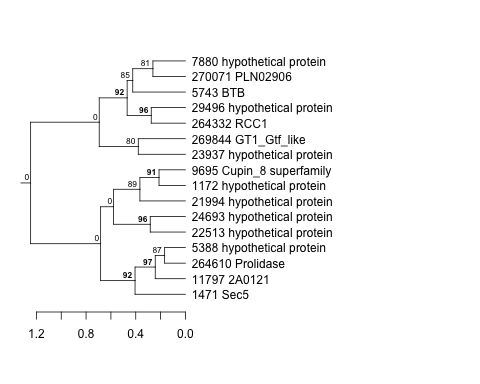 |
0.00011 |
2.3 |
3.9 |
diel_light_vs_dark | 0.051600 | -0.426 |
| Thaps_hclust_0165 |
|
|
0.00011 |
2.3 |
3.9 |
lowFe_KTKB_Day3 | 0.926000 | 0.0344 |
| Title | Cluster Plot | Dendrogram | e-value | e-value | e-value | Condition | Condition FDR | Condition Difference |
|---|---|---|---|---|---|---|---|---|
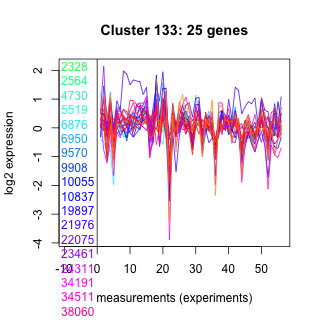
| Thaps_hclust_0133 |
 |
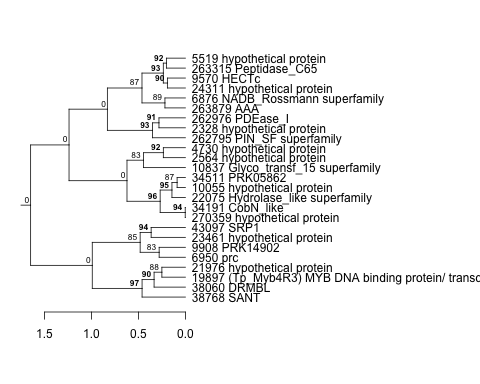 |
0.95 |
2.2 |
2.4 |
co2_elevated_stat_arrays | 0.002130 | -0.517 |
| Thaps_hclust_0133 |
|
|
0.95 |
2.2 |
2.4 |
lowtemp_TMEVA | 0.024200 | -0.507 |
| Thaps_hclust_0133 |
|
|
0.95 |
2.2 |
2.4 |
highpH_TMEVA | 0.126000 | 0.217 |
| Thaps_hclust_0133 |
|
|
0.95 |
2.2 |
2.4 |
co2_elevated_expo_arrays | 0.968000 | 0.0266 |
| Thaps_hclust_0133 |
|
|
0.95 |
2.2 |
2.4 |
lowFe_TMEVA | 0.034900 | 0.451 |
| Thaps_hclust_0133 |
|
|
0.95 |
2.2 |
2.4 |
exponential_vs_stationary_24light | 0.978000 | -0.0119 |
| Thaps_hclust_0133 |
|
|
0.95 |
2.2 |
2.4 |
lowN_TMEVA | 0.310000 | -0.324 |
| Thaps_hclust_0133 |
|
|
0.95 |
2.2 |
2.4 |
diel_exponential_vs_stationary | 0.014100 | -0.375 |
| Thaps_hclust_0133 |
|
|
0.95 |
2.2 |
2.4 |
lowSi_TMEVA | 0.557000 | 0.352 |
| Thaps_hclust_0133 |
|
|
0.95 |
2.2 |
2.4 |
highlight_arrays | 0.634000 | -0.0764 |
| Thaps_hclust_0133 |
|
|
0.95 |
2.2 |
2.4 |
diel_light_vs_dark | 0.080500 | 0.311 |
| Thaps_hclust_0133 |
|
|
0.95 |
2.2 |
2.4 |
lowFe_KTKB_Day3 | 0.443000 | -0.181 |
| Thaps_hclust_0133 |
|
|
0.95 |
2.2 |
2.4 |
lowFe_KTKB_Day5 | 0.964000 | -0.011 |
| Thaps_hclust_0133 |
|
|
0.95 |
2.2 |
2.4 |
BaP | 0.007570 | 0.494 |
| Thaps_hclust_0133 |
|
|
0.95 |
2.2 |
2.4 |
exponential_vs_stationary_24highlight | 0.195000 | 0.124 |
| Title | Cluster Plot | Dendrogram | e-value | e-value | e-value | Condition | Condition FDR | Condition Difference |
|---|---|---|---|---|---|---|---|---|
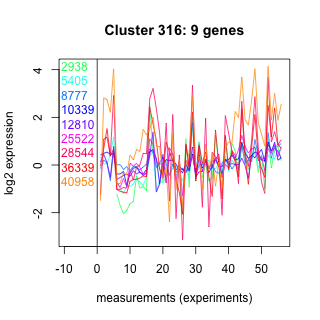
| Thaps_hclust_0316 |
 |
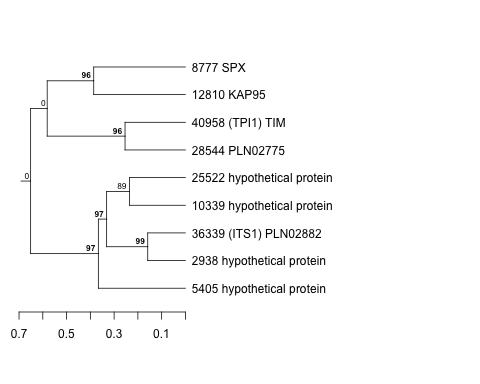 |
0.14 |
2.2 |
4.4 |
BaP | 0.929000 | 0.0387 |
| Thaps_hclust_0316 |
|
|
0.14 |
2.2 |
4.4 |
exponential_vs_stationary_24highlight | 0.010400 | -0.401 |
| Thaps_hclust_0316 |
|
|
0.14 |
2.2 |
4.4 |
co2_elevated_stat_arrays | 0.002130 | 0.872 |
| Thaps_hclust_0316 |
|
|
0.14 |
2.2 |
4.4 |
lowtemp_TMEVA | 0.000735 | 1.52 |
| Thaps_hclust_0316 |
|
|
0.14 |
2.2 |
4.4 |
highpH_TMEVA | 0.181000 | -0.297 |
| Thaps_hclust_0316 |
|
|
0.14 |
2.2 |
4.4 |
co2_elevated_expo_arrays | 0.513000 | -0.175 |
| Thaps_hclust_0316 |
|
|
0.14 |
2.2 |
4.4 |
lowFe_TMEVA | 0.029700 | 0.824 |
| Thaps_hclust_0316 |
|
|
0.14 |
2.2 |
4.4 |
exponential_vs_stationary_24light | 0.181000 | -0.582 |
| Thaps_hclust_0316 |
|
|
0.14 |
2.2 |
4.4 |
lowN_TMEVA | 0.057000 | 0.889 |
| Thaps_hclust_0316 |
|
|
0.14 |
2.2 |
4.4 |
diel_exponential_vs_stationary | 0.094900 | -0.448 |
| Thaps_hclust_0316 |
|
|
0.14 |
2.2 |
4.4 |
lowSi_TMEVA | 0.620000 | 0.379 |
| Thaps_hclust_0316 |
|
|
0.14 |
2.2 |
4.4 |
highlight_arrays | 0.897000 | -0.0325 |
| Thaps_hclust_0316 |
|
|
0.14 |
2.2 |
4.4 |
diel_light_vs_dark | 0.005770 | 0.836 |
| Thaps_hclust_0316 |
|
|
0.14 |
2.2 |
4.4 |
lowFe_KTKB_Day3 | 0.000862 | 1.37 |
| Thaps_hclust_0316 |
|
|
0.14 |
2.2 |
4.4 |
lowFe_KTKB_Day5 | 0.001320 | 1.27 |
| Title | Cluster Plot | Dendrogram | e-value | e-value | e-value | Condition | Condition FDR | Condition Difference |
|---|---|---|---|---|---|---|---|---|
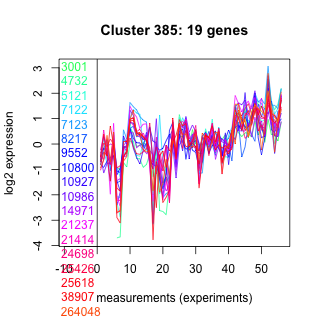
| Thaps_hclust_0385 |
 |
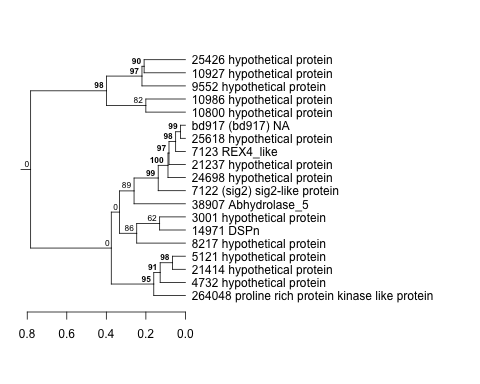 |
0.000029 |
2.1 |
2.2 |
lowFe_KTKB_Day5 | 0.001320 | -1.65 |
| Thaps_hclust_0385 |
|
|
0.000029 |
2.1 |
2.2 |
BaP | 0.000370 | -0.987 |
| Thaps_hclust_0385 |
|
|
0.000029 |
2.1 |
2.2 |
exponential_vs_stationary_24highlight | 0.034100 | -0.226 |
| Thaps_hclust_0385 |
|
|
0.000029 |
2.1 |
2.2 |
co2_elevated_stat_arrays | 0.002600 | 0.631 |
| Thaps_hclust_0385 |
|
|
0.000029 |
2.1 |
2.2 |
lowtemp_TMEVA | 0.692000 | 0.115 |
| Thaps_hclust_0385 |
|
|
0.000029 |
2.1 |
2.2 |
highpH_TMEVA | 0.000725 | -0.64 |
| Thaps_hclust_0385 |
|
|
0.000029 |
2.1 |
2.2 |
co2_elevated_expo_arrays | 0.876000 | 0.0617 |
| Thaps_hclust_0385 |
|
|
0.000029 |
2.1 |
2.2 |
lowFe_TMEVA | 0.420000 | -0.237 |
| Thaps_hclust_0385 |
|
|
0.000029 |
2.1 |
2.2 |
exponential_vs_stationary_24light | 0.294000 | -0.343 |
| Thaps_hclust_0385 |
|
|
0.000029 |
2.1 |
2.2 |
lowN_TMEVA | 0.416000 | -0.287 |
| Thaps_hclust_0385 |
|
|
0.000029 |
2.1 |
2.2 |
diel_exponential_vs_stationary | 0.896000 | 0.0311 |
| Thaps_hclust_0385 |
|
|
0.000029 |
2.1 |
2.2 |
lowSi_TMEVA | 0.071500 | -0.725 |
| Thaps_hclust_0385 |
|
|
0.000029 |
2.1 |
2.2 |
highlight_arrays | 0.154000 | -0.229 |
| Thaps_hclust_0385 |
|
|
0.000029 |
2.1 |
2.2 |
diel_light_vs_dark | 0.029900 | 0.442 |
| Thaps_hclust_0385 |
|
|
0.000029 |
2.1 |
2.2 |
lowFe_KTKB_Day3 | 0.224000 | -0.296 |
| Title | Cluster Plot | Dendrogram | e-value | e-value | e-value | Condition | Condition FDR | Condition Difference |
|---|---|---|---|---|---|---|---|---|
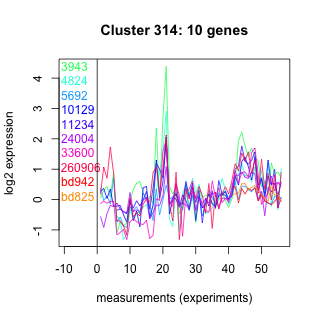
| Thaps_hclust_0314 |
 |
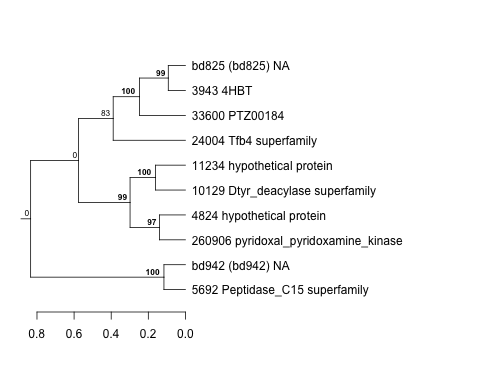 |
0.052 |
1.9 |
8.5 |
lowFe_KTKB_Day5 | 0.517000 | -0.191 |
| Thaps_hclust_0314 |
|
|
0.052 |
1.9 |
8.5 |
BaP | 0.001320 | 1.03 |
| Thaps_hclust_0314 |
|
|
0.052 |
1.9 |
8.5 |
exponential_vs_stationary_24highlight | 0.101000 | -0.245 |
| Thaps_hclust_0314 |
|
|
0.052 |
1.9 |
8.5 |
co2_elevated_stat_arrays | 0.671000 | 0.133 |
| Thaps_hclust_0314 |
|
|
0.052 |
1.9 |
8.5 |
lowtemp_TMEVA | 0.371000 | 0.321 |
| Thaps_hclust_0314 |
|
|
0.052 |
1.9 |
8.5 |
highpH_TMEVA | 0.929000 | 0.0323 |
| Thaps_hclust_0314 |
|
|
0.052 |
1.9 |
8.5 |
co2_elevated_expo_arrays | 0.969000 | -0.0277 |
| Thaps_hclust_0314 |
|
|
0.052 |
1.9 |
8.5 |
lowFe_TMEVA | 0.788000 | 0.123 |
| Thaps_hclust_0314 |
|
|
0.052 |
1.9 |
8.5 |
exponential_vs_stationary_24light | 0.614000 | -0.235 |
| Thaps_hclust_0314 |
|
|
0.052 |
1.9 |
8.5 |
lowN_TMEVA | 0.789000 | 0.115 |
| Thaps_hclust_0314 |
|
|
0.052 |
1.9 |
8.5 |
diel_exponential_vs_stationary | 0.389000 | -0.225 |
| Thaps_hclust_0314 |
|
|
0.052 |
1.9 |
8.5 |
lowSi_TMEVA | 0.758000 | 0.292 |
| Thaps_hclust_0314 |
|
|
0.052 |
1.9 |
8.5 |
highlight_arrays | 0.031900 | 0.463 |
| Thaps_hclust_0314 |
|
|
0.052 |
1.9 |
8.5 |
diel_light_vs_dark | 0.825000 | 0.0877 |
| Thaps_hclust_0314 |
|
|
0.052 |
1.9 |
8.5 |
lowFe_KTKB_Day3 | 0.177000 | -0.446 |
| Title | Cluster Plot | Dendrogram | e-value | e-value | e-value | Condition | Condition FDR | Condition Difference |
|---|---|---|---|---|---|---|---|---|
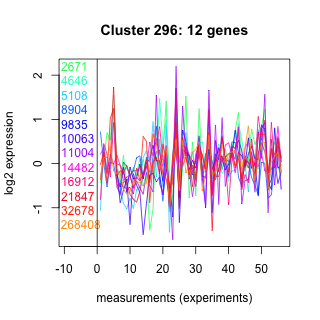
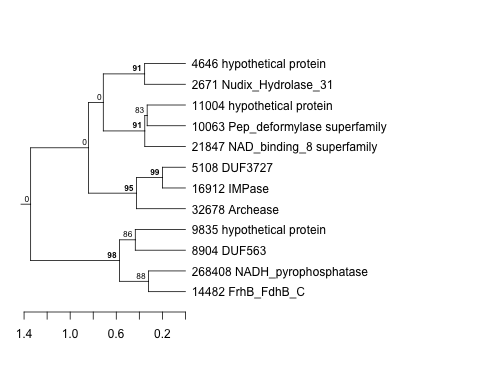
| Thaps_hclust_0296 |
 |
 |
0.17 |
1.8 |
0.83 |
lowFe_KTKB_Day3 | 0.359000 | -0.296 |
| Thaps_hclust_0296 |
|
|
0.17 |
1.8 |
0.83 |
lowFe_KTKB_Day5 | 0.787000 | 0.0803 |
| Thaps_hclust_0296 |
|
|
0.17 |
1.8 |
0.83 |
BaP | 0.522000 | 0.19 |
| Thaps_hclust_0296 |
|
|
0.17 |
1.8 |
0.83 |
exponential_vs_stationary_24highlight | 0.077000 | 0.247 |
| Thaps_hclust_0296 |
|
|
0.17 |
1.8 |
0.83 |
co2_elevated_stat_arrays | 0.062000 | -0.487 |
| Thaps_hclust_0296 |
|
|
0.17 |
1.8 |
0.83 |
lowtemp_TMEVA | 0.023500 | 0.813 |
| Thaps_hclust_0296 |
|
|
0.17 |
1.8 |
0.83 |
highpH_TMEVA | 0.187000 | -0.261 |
| Thaps_hclust_0296 |
|
|
0.17 |
1.8 |
0.83 |
co2_elevated_expo_arrays | 0.129000 | 0.275 |
| Thaps_hclust_0296 |
|
|
0.17 |
1.8 |
0.83 |
lowFe_TMEVA | 0.457000 | 0.248 |
| Thaps_hclust_0296 |
|
|
0.17 |
1.8 |
0.83 |
exponential_vs_stationary_24light | 0.420000 | 0.331 |
| Title | Cluster Plot | Dendrogram | e-value | e-value | e-value | Condition | Condition FDR | Condition Difference |
|---|---|---|---|---|---|---|---|---|
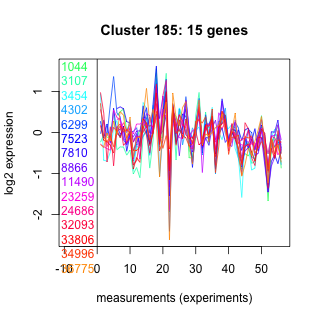
| Thaps_hclust_0185 |
 |
 |
0.000039 |
1.8 |
5.8 |
exponential_vs_stationary_24highlight | 0.330000 | 0.123 |
| Thaps_hclust_0185 |
|
|
0.000039 |
1.8 |
5.8 |
co2_elevated_stat_arrays | 0.007080 | -0.594 |
| Thaps_hclust_0185 |
|
|
0.000039 |
1.8 |
5.8 |
lowtemp_TMEVA | 0.530000 | 0.185 |
| Thaps_hclust_0185 |
|
|
0.000039 |
1.8 |
5.8 |
highpH_TMEVA | 0.116000 | 0.278 |
| Thaps_hclust_0185 |
|
|
0.000039 |
1.8 |
5.8 |
co2_elevated_expo_arrays | 0.600000 | -0.129 |
| Thaps_hclust_0185 |
|
|
0.000039 |
1.8 |
5.8 |
lowFe_TMEVA | 0.826000 | -0.0917 |
| Thaps_hclust_0185 |
|
|
0.000039 |
1.8 |
5.8 |
exponential_vs_stationary_24light | 0.690000 | 0.168 |
| Thaps_hclust_0185 |
|
|
0.000039 |
1.8 |
5.8 |
lowN_TMEVA | 0.505000 | -0.261 |
| Thaps_hclust_0185 |
|
|
0.000039 |
1.8 |
5.8 |
diel_exponential_vs_stationary | 0.437000 | -0.175 |
| Title | Cluster Plot | Dendrogram | e-value | e-value | e-value | Condition | Condition FDR | Condition Difference |
|---|---|---|---|---|---|---|---|---|
| Thaps_hclust_0498 |
 |
 |
1.3 |
1.8 |
1.8 |
co2_elevated_expo_arrays | 0.021800 | -0.33 |
| Thaps_hclust_0498 |
|
|
1.3 |
1.8 |
1.8 |
lowFe_TMEVA | 0.001040 | -1.01 |
| Thaps_hclust_0498 |
|
|
1.3 |
1.8 |
1.8 |
exponential_vs_stationary_24light | 0.117000 | -0.535 |
| Thaps_hclust_0498 |
|
|
1.3 |
1.8 |
1.8 |
lowN_TMEVA | 0.663000 | 0.179 |
| Thaps_hclust_0498 |
|
|
1.3 |
1.8 |
1.8 |
diel_exponential_vs_stationary | 0.156000 | -0.284 |
| Thaps_hclust_0498 |
|
|
1.3 |
1.8 |
1.8 |
lowSi_TMEVA | 0.010900 | -1.01 |
| Thaps_hclust_0498 |
|
|
1.3 |
1.8 |
1.8 |
highlight_arrays | 0.000442 | 0.73 |
| Thaps_hclust_0498 |
|
|
1.3 |
1.8 |
1.8 |
diel_light_vs_dark | 0.192000 | -0.299 |
| Title | Cluster Plot | Dendrogram | e-value | e-value | e-value | Condition | Condition FDR | Condition Difference |
|---|---|---|---|---|---|---|---|---|
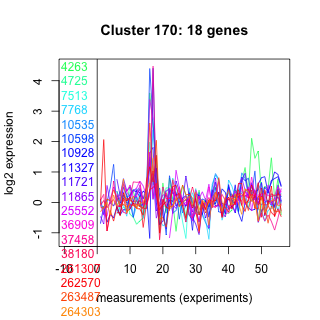
| Thaps_hclust_0170 |
 |
 |
0.028 |
1.8 |
150 |
highpH_TMEVA | 0.300000 | -0.177 |
| Thaps_hclust_0170 |
|
|
0.028 |
1.8 |
150 |
co2_elevated_expo_arrays | 0.934000 | 0.0425 |
| Thaps_hclust_0170 |
|
|
0.028 |
1.8 |
150 |
lowFe_TMEVA | 0.970000 | 0.0226 |
| Thaps_hclust_0170 |
|
|
0.028 |
1.8 |
150 |
exponential_vs_stationary_24light | 0.955000 | 0.0252 |
| Thaps_hclust_0170 |
|
|
0.028 |
1.8 |
150 |
lowN_TMEVA | 0.519000 | -0.237 |
| Thaps_hclust_0170 |
|
|
0.028 |
1.8 |
150 |
diel_exponential_vs_stationary | 0.608000 | 0.111 |
| Thaps_hclust_0170 |
|
|
0.028 |
1.8 |
150 |
lowSi_TMEVA | 1.000000 | -0.0748 |
| Thaps_hclust_0170 |
|
|
0.028 |
1.8 |
150 |
highlight_arrays | 0.465000 | 0.132 |