Hierarchical Clusters
Displaying 1701 - 1800 of 7500
| Title | Cluster Plot | Dendrogram | e-value | e-value | e-value | Condition | Condition FDR | Condition Difference |
|---|---|---|---|---|---|---|---|---|
| Thaps_hclust_0338 |
 |
 |
0.0000012 |
0.0000014 |
0.000012 |
highlight_arrays | 0.000442 | 0.52 |
| Thaps_hclust_0338 |
|
|
0.0000012 |
0.0000014 |
0.000012 |
diel_light_vs_dark | 0.809000 | -0.0542 |
| Thaps_hclust_0338 |
|
|
0.0000012 |
0.0000014 |
0.000012 |
lowFe_KTKB_Day3 | 0.736000 | 0.0794 |
| Thaps_hclust_0338 |
|
|
0.0000012 |
0.0000014 |
0.000012 |
lowFe_KTKB_Day5 | 0.015100 | 0.362 |
| Thaps_hclust_0338 |
|
|
0.0000012 |
0.0000014 |
0.000012 |
BaP | 0.029600 | 0.356 |
| Thaps_hclust_0338 |
|
|
0.0000012 |
0.0000014 |
0.000012 |
exponential_vs_stationary_24highlight | 0.774000 | 0.0271 |
| Thaps_hclust_0338 |
|
|
0.0000012 |
0.0000014 |
0.000012 |
co2_elevated_stat_arrays | 0.543000 | 0.143 |
| Thaps_hclust_0338 |
|
|
0.0000012 |
0.0000014 |
0.000012 |
lowtemp_TMEVA | 0.172000 | -0.276 |
| Thaps_hclust_0338 |
|
|
0.0000012 |
0.0000014 |
0.000012 |
highpH_TMEVA | 0.000725 | -0.453 |
| Thaps_hclust_0338 |
|
|
0.0000012 |
0.0000014 |
0.000012 |
co2_elevated_expo_arrays | 0.833000 | 0.0711 |
| Thaps_hclust_0338 |
|
|
0.0000012 |
0.0000014 |
0.000012 |
lowFe_TMEVA | 0.009170 | -0.485 |
| Thaps_hclust_0338 |
|
|
0.0000012 |
0.0000014 |
0.000012 |
exponential_vs_stationary_24light | 0.900000 | -0.0425 |
| Thaps_hclust_0338 |
|
|
0.0000012 |
0.0000014 |
0.000012 |
lowN_TMEVA | 0.789000 | -0.0989 |
| Title | Cluster Plot | Dendrogram | e-value | e-value | e-value | Condition | Condition FDR | Condition Difference |
|---|---|---|---|---|---|---|---|---|
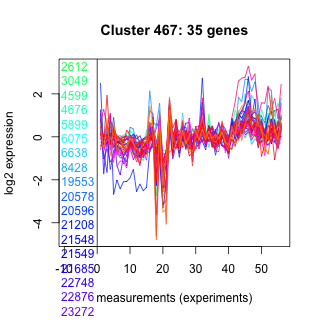
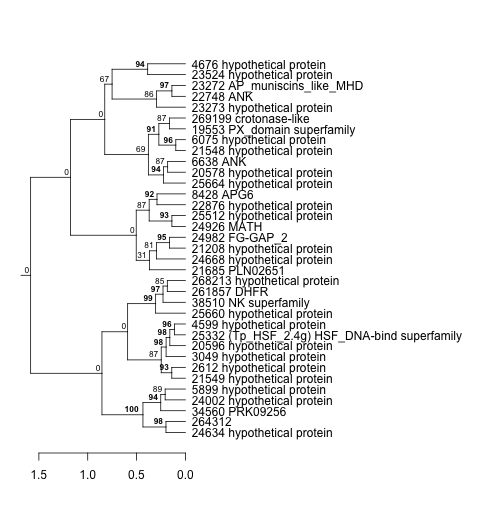
| Thaps_hclust_0467 |
 |
 |
0.000000000002 |
0.0000014 |
0.035 |
exponential_vs_stationary_24highlight | 0.198000 | -0.104 |
| Thaps_hclust_0467 |
|
|
0.000000000002 |
0.0000014 |
0.035 |
co2_elevated_stat_arrays | 0.794000 | 0.0733 |
| Thaps_hclust_0467 |
|
|
0.000000000002 |
0.0000014 |
0.035 |
lowtemp_TMEVA | 0.441000 | -0.156 |
| Thaps_hclust_0467 |
|
|
0.000000000002 |
0.0000014 |
0.035 |
highpH_TMEVA | 0.003570 | 0.345 |
| Thaps_hclust_0467 |
|
|
0.000000000002 |
0.0000014 |
0.035 |
co2_elevated_expo_arrays | 0.297000 | -0.149 |
| Thaps_hclust_0467 |
|
|
0.000000000002 |
0.0000014 |
0.035 |
lowFe_TMEVA | 0.274000 | -0.256 |
| Thaps_hclust_0467 |
|
|
0.000000000002 |
0.0000014 |
0.035 |
exponential_vs_stationary_24light | 0.562000 | -0.171 |
| Thaps_hclust_0467 |
|
|
0.000000000002 |
0.0000014 |
0.035 |
lowN_TMEVA | 0.874000 | 0.0513 |
| Thaps_hclust_0467 |
|
|
0.000000000002 |
0.0000014 |
0.035 |
diel_exponential_vs_stationary | 0.173000 | 0.184 |
| Thaps_hclust_0467 |
|
|
0.000000000002 |
0.0000014 |
0.035 |
lowSi_TMEVA | 1.000000 | -0.0909 |
| Thaps_hclust_0467 |
|
|
0.000000000002 |
0.0000014 |
0.035 |
highlight_arrays | 0.007380 | 0.301 |
| Thaps_hclust_0467 |
|
|
0.000000000002 |
0.0000014 |
0.035 |
diel_light_vs_dark | 0.035800 | -0.311 |
| Title | Cluster Plot | Dendrogram | e-value | e-value | e-value | Condition | Condition FDR | Condition Difference |
|---|---|---|---|---|---|---|---|---|
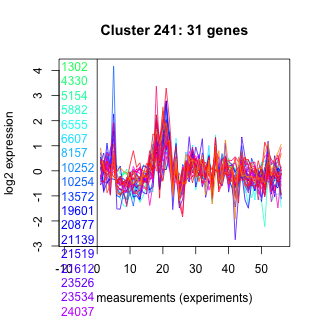
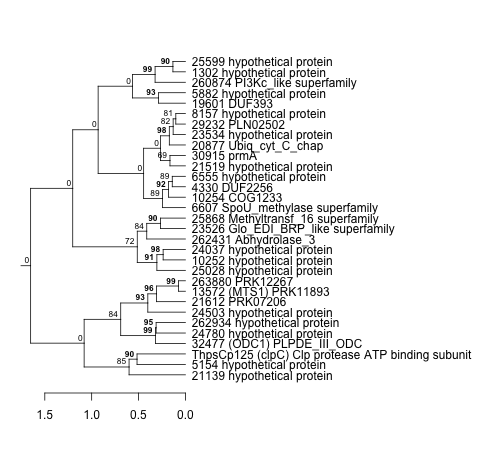
| Thaps_hclust_0241 |
 |
 |
0.0000000022 |
0.0000017 |
0.68 |
exponential_vs_stationary_24highlight | 0.578000 | 0.0529 |
| Thaps_hclust_0241 |
|
|
0.0000000022 |
0.0000017 |
0.68 |
co2_elevated_stat_arrays | 0.112000 | 0.301 |
| Thaps_hclust_0241 |
|
|
0.0000000022 |
0.0000017 |
0.68 |
lowtemp_TMEVA | 0.000735 | 0.876 |
| Thaps_hclust_0241 |
|
|
0.0000000022 |
0.0000017 |
0.68 |
highpH_TMEVA | 0.664000 | 0.0674 |
| Thaps_hclust_0241 |
|
|
0.0000000022 |
0.0000017 |
0.68 |
co2_elevated_expo_arrays | 1.000000 | -0.0000501 |
| Thaps_hclust_0241 |
|
|
0.0000000022 |
0.0000017 |
0.68 |
lowFe_TMEVA | 0.996000 | -0.0027 |
| Thaps_hclust_0241 |
|
|
0.0000000022 |
0.0000017 |
0.68 |
exponential_vs_stationary_24light | 0.522000 | -0.191 |
| Thaps_hclust_0241 |
|
|
0.0000000022 |
0.0000017 |
0.68 |
lowN_TMEVA | 0.761000 | 0.109 |
| Thaps_hclust_0241 |
|
|
0.0000000022 |
0.0000017 |
0.68 |
diel_exponential_vs_stationary | 0.313000 | -0.153 |
| Thaps_hclust_0241 |
|
|
0.0000000022 |
0.0000017 |
0.68 |
lowSi_TMEVA | 1.000000 | -0.0192 |
| Thaps_hclust_0241 |
|
|
0.0000000022 |
0.0000017 |
0.68 |
highlight_arrays | 0.941000 | -0.0125 |
| Thaps_hclust_0241 |
|
|
0.0000000022 |
0.0000017 |
0.68 |
diel_light_vs_dark | 0.048900 | -0.308 |
| Thaps_hclust_0241 |
|
|
0.0000000022 |
0.0000017 |
0.68 |
lowFe_KTKB_Day3 | 0.936000 | -0.0193 |
| Thaps_hclust_0241 |
|
|
0.0000000022 |
0.0000017 |
0.68 |
lowFe_KTKB_Day5 | 0.275000 | 0.181 |
| Thaps_hclust_0241 |
|
|
0.0000000022 |
0.0000017 |
0.68 |
BaP | 0.000370 | 1.1 |
| Title | Cluster Plot | Dendrogram | e-value | e-value | e-value | Condition | Condition FDR | Condition Difference |
|---|---|---|---|---|---|---|---|---|
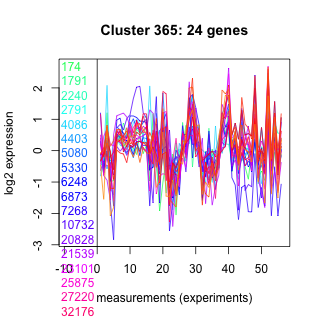
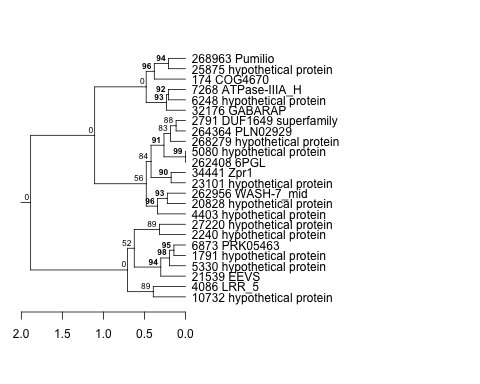
| Thaps_hclust_0365 |
 |
 |
0.00082 |
0.0000019 |
2 |
co2_elevated_stat_arrays | 0.000658 | 0.698 |
| Thaps_hclust_0365 |
|
|
0.00082 |
0.0000019 |
2 |
lowtemp_TMEVA | 0.002670 | -0.689 |
| Thaps_hclust_0365 |
|
|
0.00082 |
0.0000019 |
2 |
highpH_TMEVA | 0.771000 | -0.0532 |
| Thaps_hclust_0365 |
|
|
0.00082 |
0.0000019 |
2 |
co2_elevated_expo_arrays | 0.288000 | -0.17 |
| Thaps_hclust_0365 |
|
|
0.00082 |
0.0000019 |
2 |
lowFe_TMEVA | 0.128000 | -0.377 |
| Thaps_hclust_0365 |
|
|
0.00082 |
0.0000019 |
2 |
exponential_vs_stationary_24light | 0.000581 | -1.1 |
| Thaps_hclust_0365 |
|
|
0.00082 |
0.0000019 |
2 |
lowN_TMEVA | 0.356000 | 0.297 |
| Thaps_hclust_0365 |
|
|
0.00082 |
0.0000019 |
2 |
diel_exponential_vs_stationary | 0.000602 | -1.19 |
| Thaps_hclust_0365 |
|
|
0.00082 |
0.0000019 |
2 |
lowSi_TMEVA | 0.059600 | -0.682 |
| Thaps_hclust_0365 |
|
|
0.00082 |
0.0000019 |
2 |
highlight_arrays | 0.423000 | 0.124 |
| Thaps_hclust_0365 |
|
|
0.00082 |
0.0000019 |
2 |
diel_light_vs_dark | 0.621000 | -0.117 |
| Thaps_hclust_0365 |
|
|
0.00082 |
0.0000019 |
2 |
lowFe_KTKB_Day3 | 0.604000 | -0.124 |
| Thaps_hclust_0365 |
|
|
0.00082 |
0.0000019 |
2 |
lowFe_KTKB_Day5 | 0.571000 | 0.112 |
| Thaps_hclust_0365 |
|
|
0.00082 |
0.0000019 |
2 |
BaP | 0.841000 | 0.0504 |
| Thaps_hclust_0365 |
|
|
0.00082 |
0.0000019 |
2 |
exponential_vs_stationary_24highlight | 0.000526 | -0.602 |
| Title | Cluster Plot | Dendrogram | e-value | e-value | e-value | Condition | Condition FDR | Condition Difference |
|---|---|---|---|---|---|---|---|---|
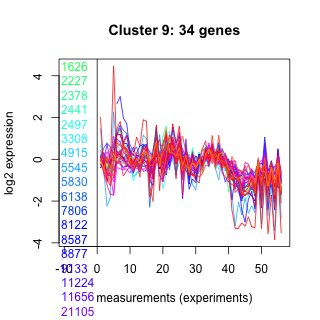
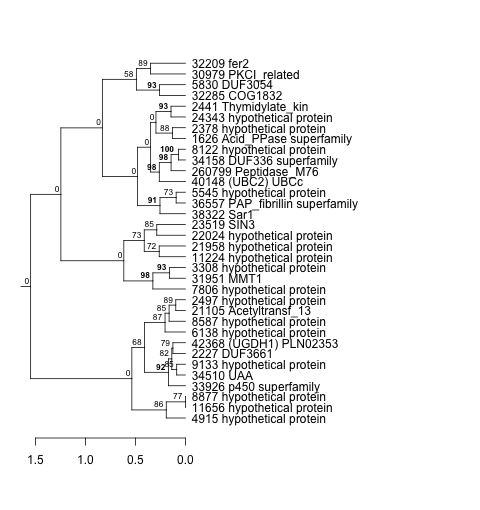
| Thaps_hclust_0009 |
 |
 |
0.0000023 |
0.0000027 |
0.000035 |
diel_exponential_vs_stationary | 0.005310 | 0.361 |
| Thaps_hclust_0009 |
|
|
0.0000023 |
0.0000027 |
0.000035 |
lowSi_TMEVA | 0.296000 | -0.444 |
| Thaps_hclust_0009 |
|
|
0.0000023 |
0.0000027 |
0.000035 |
highlight_arrays | 0.017500 | -0.286 |
| Thaps_hclust_0009 |
|
|
0.0000023 |
0.0000027 |
0.000035 |
diel_light_vs_dark | 0.044000 | 0.307 |
| Thaps_hclust_0009 |
|
|
0.0000023 |
0.0000027 |
0.000035 |
lowFe_KTKB_Day3 | 0.003620 | -0.489 |
| Thaps_hclust_0009 |
|
|
0.0000023 |
0.0000027 |
0.000035 |
lowFe_KTKB_Day5 | 0.062800 | -0.284 |
| Thaps_hclust_0009 |
|
|
0.0000023 |
0.0000027 |
0.000035 |
BaP | 0.267000 | 0.186 |
| Thaps_hclust_0009 |
|
|
0.0000023 |
0.0000027 |
0.000035 |
exponential_vs_stationary_24highlight | 0.000526 | 0.272 |
| Thaps_hclust_0009 |
|
|
0.0000023 |
0.0000027 |
0.000035 |
co2_elevated_stat_arrays | 0.320000 | -0.204 |
| Thaps_hclust_0009 |
|
|
0.0000023 |
0.0000027 |
0.000035 |
lowtemp_TMEVA | 0.498000 | 0.141 |
| Thaps_hclust_0009 |
|
|
0.0000023 |
0.0000027 |
0.000035 |
highpH_TMEVA | 0.275000 | 0.144 |
| Thaps_hclust_0009 |
|
|
0.0000023 |
0.0000027 |
0.000035 |
co2_elevated_expo_arrays | 0.600000 | 0.106 |
| Thaps_hclust_0009 |
|
|
0.0000023 |
0.0000027 |
0.000035 |
lowFe_TMEVA | 0.622000 | -0.144 |
| Thaps_hclust_0009 |
|
|
0.0000023 |
0.0000027 |
0.000035 |
exponential_vs_stationary_24light | 0.000581 | 1.01 |
| Thaps_hclust_0009 |
|
|
0.0000023 |
0.0000027 |
0.000035 |
lowN_TMEVA | 0.099500 | -0.42 |
| Title | Cluster Plot | Dendrogram | e-value | e-value | e-value | Condition | Condition FDR | Condition Difference |
|---|---|---|---|---|---|---|---|---|
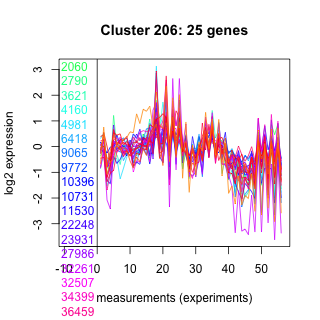
| Thaps_hclust_0206 |
 |
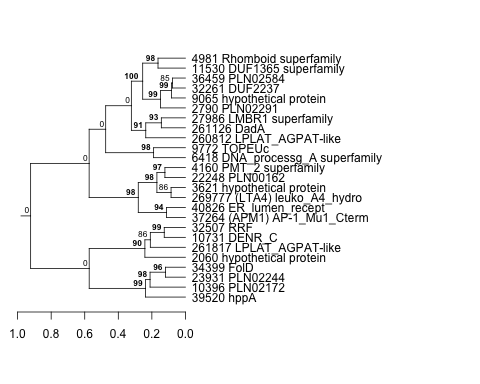 |
0.00000000000075 |
0.0000028 |
3.5 |
exponential_vs_stationary_24highlight | 0.000526 | 0.494 |
| Thaps_hclust_0206 |
|
|
0.00000000000075 |
0.0000028 |
3.5 |
co2_elevated_stat_arrays | 0.353000 | -0.207 |
| Thaps_hclust_0206 |
|
|
0.00000000000075 |
0.0000028 |
3.5 |
lowtemp_TMEVA | 0.909000 | 0.0348 |
| Thaps_hclust_0206 |
|
|
0.00000000000075 |
0.0000028 |
3.5 |
highpH_TMEVA | 0.242000 | -0.17 |
| Thaps_hclust_0206 |
|
|
0.00000000000075 |
0.0000028 |
3.5 |
co2_elevated_expo_arrays | 0.969000 | 0.0243 |
| Thaps_hclust_0206 |
|
|
0.00000000000075 |
0.0000028 |
3.5 |
lowFe_TMEVA | 0.853000 | 0.0703 |
| Thaps_hclust_0206 |
|
|
0.00000000000075 |
0.0000028 |
3.5 |
exponential_vs_stationary_24light | 0.000581 | 1.28 |
| Thaps_hclust_0206 |
|
|
0.00000000000075 |
0.0000028 |
3.5 |
lowN_TMEVA | 0.001190 | -0.92 |
| Thaps_hclust_0206 |
|
|
0.00000000000075 |
0.0000028 |
3.5 |
diel_exponential_vs_stationary | 0.002080 | 0.474 |
| Thaps_hclust_0206 |
|
|
0.00000000000075 |
0.0000028 |
3.5 |
lowSi_TMEVA | 0.022400 | -0.766 |
| Thaps_hclust_0206 |
|
|
0.00000000000075 |
0.0000028 |
3.5 |
highlight_arrays | 0.000442 | -0.568 |
| Thaps_hclust_0206 |
|
|
0.00000000000075 |
0.0000028 |
3.5 |
diel_light_vs_dark | 0.000485 | 0.717 |
| Thaps_hclust_0206 |
|
|
0.00000000000075 |
0.0000028 |
3.5 |
lowFe_KTKB_Day3 | 0.172000 | 0.28 |
| Thaps_hclust_0206 |
|
|
0.00000000000075 |
0.0000028 |
3.5 |
lowFe_KTKB_Day5 | 0.090100 | 0.295 |
| Thaps_hclust_0206 |
|
|
0.00000000000075 |
0.0000028 |
3.5 |
BaP | 0.000370 | 0.811 |
| Title | Cluster Plot | Dendrogram | e-value | e-value | e-value | Condition | Condition FDR | Condition Difference |
|---|---|---|---|---|---|---|---|---|
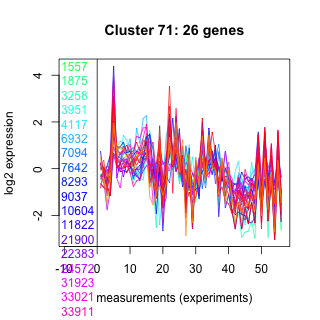
| Thaps_hclust_0071 |
 |
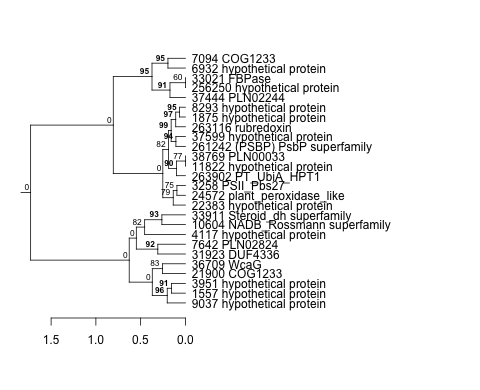 |
0.0000019 |
0.0000028 |
0.00008 |
exponential_vs_stationary_24highlight | 0.000526 | 0.319 |
| Thaps_hclust_0071 |
|
|
0.0000019 |
0.0000028 |
0.00008 |
co2_elevated_stat_arrays | 0.503000 | 0.159 |
| Thaps_hclust_0071 |
|
|
0.0000019 |
0.0000028 |
0.00008 |
lowtemp_TMEVA | 0.000735 | 2.35 |
| Thaps_hclust_0071 |
|
|
0.0000019 |
0.0000028 |
0.00008 |
highpH_TMEVA | 0.492000 | -0.107 |
| Thaps_hclust_0071 |
|
|
0.0000019 |
0.0000028 |
0.00008 |
co2_elevated_expo_arrays | 0.002630 | 0.349 |
| Thaps_hclust_0071 |
|
|
0.0000019 |
0.0000028 |
0.00008 |
lowFe_TMEVA | 0.337000 | -0.244 |
| Thaps_hclust_0071 |
|
|
0.0000019 |
0.0000028 |
0.00008 |
exponential_vs_stationary_24light | 0.000581 | 1.88 |
| Thaps_hclust_0071 |
|
|
0.0000019 |
0.0000028 |
0.00008 |
lowN_TMEVA | 0.031600 | -0.601 |
| Thaps_hclust_0071 |
|
|
0.0000019 |
0.0000028 |
0.00008 |
diel_exponential_vs_stationary | 0.000602 | 0.995 |
| Thaps_hclust_0071 |
|
|
0.0000019 |
0.0000028 |
0.00008 |
lowSi_TMEVA | 0.557000 | -0.349 |
| Thaps_hclust_0071 |
|
|
0.0000019 |
0.0000028 |
0.00008 |
highlight_arrays | 0.000442 | -0.66 |
| Thaps_hclust_0071 |
|
|
0.0000019 |
0.0000028 |
0.00008 |
diel_light_vs_dark | 0.000485 | -0.596 |
| Thaps_hclust_0071 |
|
|
0.0000019 |
0.0000028 |
0.00008 |
lowFe_KTKB_Day3 | 0.369000 | 0.196 |
| Thaps_hclust_0071 |
|
|
0.0000019 |
0.0000028 |
0.00008 |
lowFe_KTKB_Day5 | 0.605000 | -0.101 |
| Thaps_hclust_0071 |
|
|
0.0000019 |
0.0000028 |
0.00008 |
BaP | 0.034800 | -0.394 |