Hierarchical Clusters
Displaying 1701 - 1800 of 7500
| Title | Cluster Plot | Dendrogram | e-value | e-value | e-value | Condition | Condition FDR | Condition Difference |
|---|---|---|---|---|---|---|---|---|
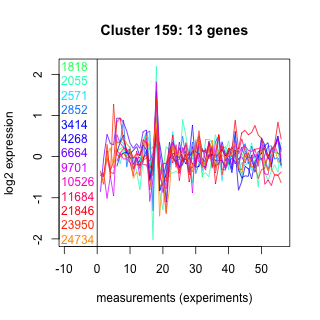
| Thaps_hclust_0159 |
 |
 |
0.087 |
1.3 |
3 |
lowFe_KTKB_Day3 | 0.369000 | -0.274 |
| Thaps_hclust_0159 |
|
|
0.087 |
1.3 |
3 |
lowFe_KTKB_Day5 | 0.118000 | -0.395 |
| Thaps_hclust_0159 |
|
|
0.087 |
1.3 |
3 |
BaP | 0.652000 | -0.134 |
| Thaps_hclust_0159 |
|
|
0.087 |
1.3 |
3 |
exponential_vs_stationary_24highlight | 0.602000 | -0.0758 |
| Thaps_hclust_0159 |
|
|
0.087 |
1.3 |
3 |
co2_elevated_stat_arrays | 0.435000 | -0.212 |
| Thaps_hclust_0159 |
|
|
0.087 |
1.3 |
3 |
lowtemp_TMEVA | 0.935000 | -0.0322 |
| Thaps_hclust_0159 |
|
|
0.087 |
1.3 |
3 |
highpH_TMEVA | 0.008100 | -0.524 |
| Thaps_hclust_0159 |
|
|
0.087 |
1.3 |
3 |
co2_elevated_expo_arrays | 1.000000 | -0.00147 |
| Thaps_hclust_0159 |
|
|
0.087 |
1.3 |
3 |
lowFe_TMEVA | 0.162000 | -0.446 |
| Thaps_hclust_0159 |
|
|
0.087 |
1.3 |
3 |
exponential_vs_stationary_24light | 0.945000 | -0.0337 |
| Title | Cluster Plot | Dendrogram | e-value | e-value | e-value | Condition | Condition FDR | Condition Difference |
|---|---|---|---|---|---|---|---|---|
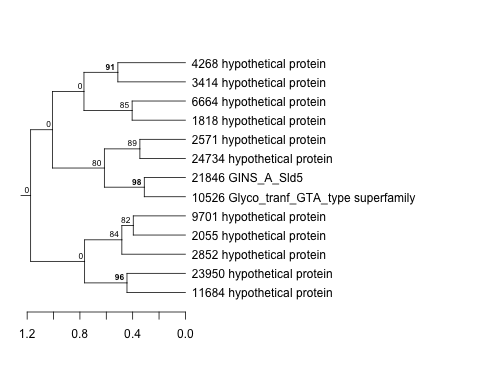
| Thaps_hclust_0114 |
 |
 |
0.086 |
4.8 |
3.2 |
co2_elevated_expo_arrays | 0.443000 | 0.152 |
| Thaps_hclust_0114 |
|
|
0.086 |
4.8 |
3.2 |
lowFe_TMEVA | 0.257000 | -0.327 |
| Thaps_hclust_0114 |
|
|
0.086 |
4.8 |
3.2 |
exponential_vs_stationary_24light | 0.055900 | -0.617 |
| Thaps_hclust_0114 |
|
|
0.086 |
4.8 |
3.2 |
lowN_TMEVA | 0.784000 | 0.109 |
| Thaps_hclust_0114 |
|
|
0.086 |
4.8 |
3.2 |
diel_exponential_vs_stationary | 0.021700 | -0.423 |
| Thaps_hclust_0114 |
|
|
0.086 |
4.8 |
3.2 |
lowSi_TMEVA | 0.679000 | -0.307 |
| Thaps_hclust_0114 |
|
|
0.086 |
4.8 |
3.2 |
highlight_arrays | 0.000442 | 0.614 |
| Thaps_hclust_0114 |
|
|
0.086 |
4.8 |
3.2 |
diel_light_vs_dark | 0.796000 | -0.0787 |
| Thaps_hclust_0114 |
|
|
0.086 |
4.8 |
3.2 |
lowFe_KTKB_Day3 | 0.000862 | -0.877 |
| Thaps_hclust_0114 |
|
|
0.086 |
4.8 |
3.2 |
lowFe_KTKB_Day5 | 0.317000 | -0.215 |
| Thaps_hclust_0114 |
|
|
0.086 |
4.8 |
3.2 |
BaP | 0.000370 | 1.65 |
| Thaps_hclust_0114 |
|
|
0.086 |
4.8 |
3.2 |
exponential_vs_stationary_24highlight | 0.005770 | -0.312 |
| Thaps_hclust_0114 |
|
|
0.086 |
4.8 |
3.2 |
co2_elevated_stat_arrays | 0.001190 | 0.693 |
| Thaps_hclust_0114 |
|
|
0.086 |
4.8 |
3.2 |
lowtemp_TMEVA | 0.650000 | -0.131 |
| Thaps_hclust_0114 |
|
|
0.086 |
4.8 |
3.2 |
highpH_TMEVA | 0.964000 | -0.0143 |
| Title | Cluster Plot | Dendrogram | e-value | e-value | e-value | Condition | Condition FDR | Condition Difference |
|---|---|---|---|---|---|---|---|---|
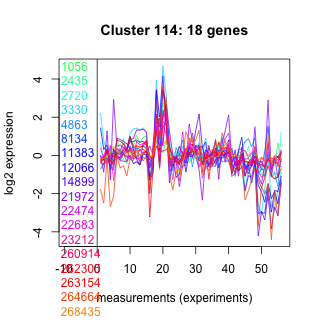
| Thaps_hclust_0396 |
 |
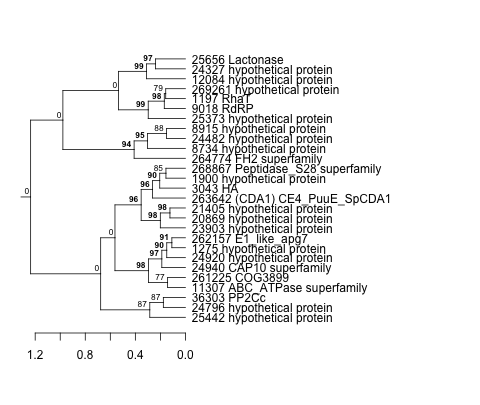 |
0.082 |
10 |
29 |
co2_elevated_stat_arrays | 0.010300 | -0.439 |
| Thaps_hclust_0396 |
|
|
0.082 |
10 |
29 |
lowtemp_TMEVA | 0.247000 | -0.254 |
| Thaps_hclust_0396 |
|
|
0.082 |
10 |
29 |
highpH_TMEVA | 0.281000 | 0.156 |
| Thaps_hclust_0396 |
|
|
0.082 |
10 |
29 |
co2_elevated_expo_arrays | 0.971000 | -0.0217 |
| Thaps_hclust_0396 |
|
|
0.082 |
10 |
29 |
lowFe_TMEVA | 0.975000 | 0.0177 |
| Thaps_hclust_0396 |
|
|
0.082 |
10 |
29 |
exponential_vs_stationary_24light | 0.349000 | -0.275 |
| Thaps_hclust_0396 |
|
|
0.082 |
10 |
29 |
lowN_TMEVA | 0.724000 | 0.129 |
| Thaps_hclust_0396 |
|
|
0.082 |
10 |
29 |
diel_exponential_vs_stationary | 0.005310 | -0.407 |
| Thaps_hclust_0396 |
|
|
0.082 |
10 |
29 |
lowSi_TMEVA | 0.806000 | 0.241 |
| Thaps_hclust_0396 |
|
|
0.082 |
10 |
29 |
highlight_arrays | 0.095200 | 0.232 |
| Thaps_hclust_0396 |
|
|
0.082 |
10 |
29 |
diel_light_vs_dark | 0.970000 | -0.0113 |
| Thaps_hclust_0396 |
|
|
0.082 |
10 |
29 |
lowFe_KTKB_Day3 | 0.157000 | -0.278 |
| Thaps_hclust_0396 |
|
|
0.082 |
10 |
29 |
lowFe_KTKB_Day5 | 0.124000 | -0.267 |
| Thaps_hclust_0396 |
|
|
0.082 |
10 |
29 |
BaP | 0.000370 | -0.716 |
| Thaps_hclust_0396 |
|
|
0.082 |
10 |
29 |
exponential_vs_stationary_24highlight | 0.273000 | -0.102 |
| Title | Cluster Plot | Dendrogram | e-value | e-value | e-value | Condition | Condition FDR | Condition Difference |
|---|---|---|---|---|---|---|---|---|
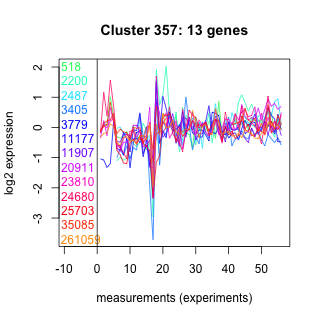
| Thaps_hclust_0357 |
 |
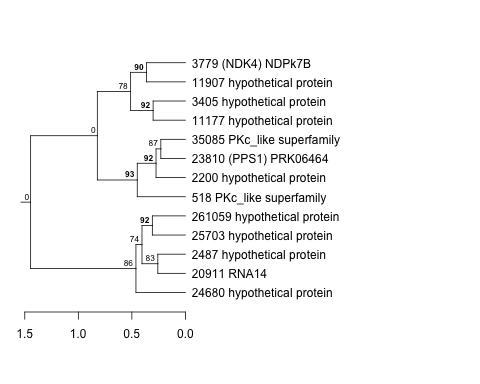 |
0.077 |
0.1 |
0.81 |
lowFe_KTKB_Day5 | 0.001320 | -1.9 |
| Thaps_hclust_0357 |
|
|
0.077 |
0.1 |
0.81 |
BaP | 0.426000 | 0.224 |
| Thaps_hclust_0357 |
|
|
0.077 |
0.1 |
0.81 |
exponential_vs_stationary_24highlight | 0.799000 | -0.0389 |
| Thaps_hclust_0357 |
|
|
0.077 |
0.1 |
0.81 |
co2_elevated_stat_arrays | 0.543000 | 0.168 |
| Thaps_hclust_0357 |
|
|
0.077 |
0.1 |
0.81 |
lowtemp_TMEVA | 0.339000 | 0.301 |
| Thaps_hclust_0357 |
|
|
0.077 |
0.1 |
0.81 |
highpH_TMEVA | 0.107000 | -0.313 |
| Thaps_hclust_0357 |
|
|
0.077 |
0.1 |
0.81 |
co2_elevated_expo_arrays | 0.959000 | 0.0315 |
| Thaps_hclust_0357 |
|
|
0.077 |
0.1 |
0.81 |
lowFe_TMEVA | 0.888000 | 0.0622 |
| Thaps_hclust_0357 |
|
|
0.077 |
0.1 |
0.81 |
exponential_vs_stationary_24light | 0.965000 | -0.0202 |
| Thaps_hclust_0357 |
|
|
0.077 |
0.1 |
0.81 |
lowN_TMEVA | 0.761000 | -0.128 |
| Thaps_hclust_0357 |
|
|
0.077 |
0.1 |
0.81 |
diel_exponential_vs_stationary | 0.931000 | 0.0275 |
| Thaps_hclust_0357 |
|
|
0.077 |
0.1 |
0.81 |
lowSi_TMEVA | 0.500000 | 0.433 |
| Thaps_hclust_0357 |
|
|
0.077 |
0.1 |
0.81 |
highlight_arrays | 0.939000 | -0.0202 |
| Thaps_hclust_0357 |
|
|
0.077 |
0.1 |
0.81 |
diel_light_vs_dark | 0.972000 | -0.013 |
| Thaps_hclust_0357 |
|
|
0.077 |
0.1 |
0.81 |
lowFe_KTKB_Day3 | 0.056500 | -0.552 |
| Title | Cluster Plot | Dendrogram | e-value | e-value | e-value | Condition | Condition FDR | Condition Difference |
|---|---|---|---|---|---|---|---|---|
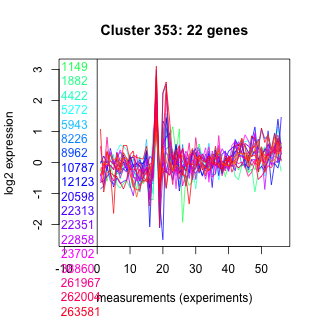
| Thaps_hclust_0353 |
 |
 |
0.076 |
1.5 |
0.87 |
highlight_arrays | 0.860000 | -0.0306 |
| Thaps_hclust_0353 |
|
|
0.076 |
1.5 |
0.87 |
diel_light_vs_dark | 0.926000 | -0.0317 |
| Thaps_hclust_0353 |
|
|
0.076 |
1.5 |
0.87 |
lowFe_KTKB_Day3 | 0.000862 | -0.7 |
| Thaps_hclust_0353 |
|
|
0.076 |
1.5 |
0.87 |
lowFe_KTKB_Day5 | 0.559000 | -0.126 |
| Thaps_hclust_0353 |
|
|
0.076 |
1.5 |
0.87 |
BaP | 0.006590 | 0.506 |
| Thaps_hclust_0353 |
|
|
0.076 |
1.5 |
0.87 |
exponential_vs_stationary_24highlight | 0.669000 | -0.048 |
| Thaps_hclust_0353 |
|
|
0.076 |
1.5 |
0.87 |
co2_elevated_stat_arrays | 0.585000 | 0.136 |
| Thaps_hclust_0353 |
|
|
0.076 |
1.5 |
0.87 |
lowtemp_TMEVA | 0.186000 | -0.313 |
| Thaps_hclust_0353 |
|
|
0.076 |
1.5 |
0.87 |
highpH_TMEVA | 0.178000 | -0.207 |
| Thaps_hclust_0353 |
|
|
0.076 |
1.5 |
0.87 |
co2_elevated_expo_arrays | 0.677000 | 0.104 |
| Thaps_hclust_0353 |
|
|
0.076 |
1.5 |
0.87 |
lowFe_TMEVA | 0.245000 | -0.313 |
| Thaps_hclust_0353 |
|
|
0.076 |
1.5 |
0.87 |
exponential_vs_stationary_24light | 0.611000 | -0.181 |
| Thaps_hclust_0353 |
|
|
0.076 |
1.5 |
0.87 |
lowN_TMEVA | 0.861000 | -0.0641 |
| Thaps_hclust_0353 |
|
|
0.076 |
1.5 |
0.87 |
diel_exponential_vs_stationary | 0.841000 | 0.0447 |
| Thaps_hclust_0353 |
|
|
0.076 |
1.5 |
0.87 |
lowSi_TMEVA | 1.000000 | -0.0506 |
| Title | Cluster Plot | Dendrogram | e-value | e-value | e-value | Condition | Condition FDR | Condition Difference |
|---|---|---|---|---|---|---|---|---|
| Thaps_hclust_0075 |
 |
 |
0.069 |
53 |
33 |
exponential_vs_stationary_24light | 0.003090 | 1.14 |
| Thaps_hclust_0075 |
|
|
0.069 |
53 |
33 |
lowN_TMEVA | 0.187000 | -0.535 |
| Thaps_hclust_0075 |
|
|
0.069 |
53 |
33 |
diel_exponential_vs_stationary | 0.556000 | 0.151 |
| Thaps_hclust_0075 |
|
|
0.069 |
53 |
33 |
lowSi_TMEVA | 0.631000 | -0.359 |
| Thaps_hclust_0075 |
|
|
0.069 |
53 |
33 |
highlight_arrays | 0.000442 | -0.829 |
| Thaps_hclust_0075 |
|
|
0.069 |
53 |
33 |
diel_light_vs_dark | 0.017100 | 0.603 |
| Thaps_hclust_0075 |
|
|
0.069 |
53 |
33 |
lowFe_KTKB_Day3 | 0.509000 | 0.22 |
| Thaps_hclust_0075 |
|
|
0.069 |
53 |
33 |
lowFe_KTKB_Day5 | 0.849000 | 0.0562 |
| Thaps_hclust_0075 |
|
|
0.069 |
53 |
33 |
BaP | 0.562000 | 0.175 |
| Thaps_hclust_0075 |
|
|
0.069 |
53 |
33 |
exponential_vs_stationary_24highlight | 0.024500 | 0.311 |
| Thaps_hclust_0075 |
|
|
0.069 |
53 |
33 |
co2_elevated_stat_arrays | 0.111000 | -0.426 |
| Thaps_hclust_0075 |
|
|
0.069 |
53 |
33 |
lowtemp_TMEVA | 0.929000 | -0.0355 |
| Thaps_hclust_0075 |
|
|
0.069 |
53 |
33 |
highpH_TMEVA | 0.012200 | -0.516 |
| Thaps_hclust_0075 |
|
|
0.069 |
53 |
33 |
co2_elevated_expo_arrays | 0.129000 | 0.275 |
| Thaps_hclust_0075 |
|
|
0.069 |
53 |
33 |
lowFe_TMEVA | 0.981000 | 0.0153 |
| Title | Cluster Plot | Dendrogram | e-value | e-value | e-value | Condition | Condition FDR | Condition Difference |
|---|---|---|---|---|---|---|---|---|
| Thaps_hclust_0436 |
 |
 |
0.067 |
0.93 |
0.55 |
lowFe_TMEVA | 0.996000 | -0.0041 |
| Thaps_hclust_0436 |
|
|
0.067 |
0.93 |
0.55 |
exponential_vs_stationary_24light | 0.177000 | -0.481 |
| Thaps_hclust_0436 |
|
|
0.067 |
0.93 |
0.55 |
lowN_TMEVA | 0.861000 | -0.0707 |
| Thaps_hclust_0436 |
|
|
0.067 |
0.93 |
0.55 |
diel_exponential_vs_stationary | 0.124000 | -0.311 |
| Thaps_hclust_0436 |
|
|
0.067 |
0.93 |
0.55 |
lowSi_TMEVA | 1.000000 | 0.0422 |
| Thaps_hclust_0436 |
|
|
0.067 |
0.93 |
0.55 |
highlight_arrays | 0.579000 | -0.108 |
| Thaps_hclust_0436 |
|
|
0.067 |
0.93 |
0.55 |
diel_light_vs_dark | 0.731000 | -0.102 |
| Thaps_hclust_0436 |
|
|
0.067 |
0.93 |
0.55 |
lowFe_KTKB_Day3 | 0.229000 | 0.328 |
| Thaps_hclust_0436 |
|
|
0.067 |
0.93 |
0.55 |
lowFe_KTKB_Day5 | 0.231000 | 0.285 |
| Thaps_hclust_0436 |
|
|
0.067 |
0.93 |
0.55 |
BaP | 0.694000 | 0.109 |
| Thaps_hclust_0436 |
|
|
0.067 |
0.93 |
0.55 |
exponential_vs_stationary_24highlight | 0.701000 | -0.0538 |
| Thaps_hclust_0436 |
|
|
0.067 |
0.93 |
0.55 |
co2_elevated_stat_arrays | 0.557000 | -0.158 |
| Thaps_hclust_0436 |
|
|
0.067 |
0.93 |
0.55 |
lowtemp_TMEVA | 0.187000 | -0.381 |
| Thaps_hclust_0436 |
|
|
0.067 |
0.93 |
0.55 |
highpH_TMEVA | 0.332000 | -0.179 |
| Thaps_hclust_0436 |
|
|
0.067 |
0.93 |
0.55 |
co2_elevated_expo_arrays | 0.944000 | 0.034 |