Hierarchical Clusters
Displaying 1901 - 2000 of 7500
| Title | Cluster Plot | Dendrogram | e-value | e-value | e-value | Condition | Condition FDR | Condition Difference |
|---|---|---|---|---|---|---|---|---|
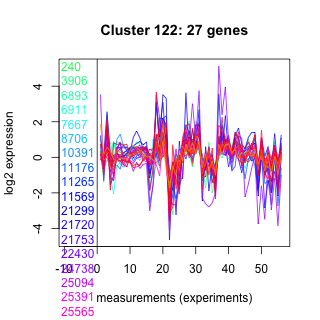
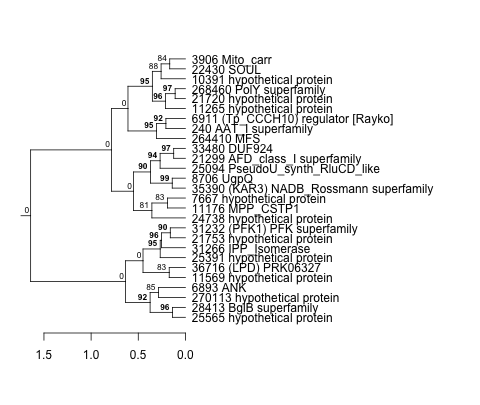
| Thaps_hclust_0122 |
 |
 |
0.0000037 |
0.061 |
0.0018 |
co2_elevated_stat_arrays | 0.178000 | -0.273 |
| Thaps_hclust_0122 |
|
|
0.0000037 |
0.061 |
0.0018 |
lowtemp_TMEVA | 0.109000 | -0.344 |
| Thaps_hclust_0122 |
|
|
0.0000037 |
0.061 |
0.0018 |
highpH_TMEVA | 0.000725 | 0.544 |
| Thaps_hclust_0122 |
|
|
0.0000037 |
0.061 |
0.0018 |
co2_elevated_expo_arrays | 0.145000 | 0.195 |
| Thaps_hclust_0122 |
|
|
0.0000037 |
0.061 |
0.0018 |
lowFe_TMEVA | 0.212000 | -0.305 |
| Thaps_hclust_0122 |
|
|
0.0000037 |
0.061 |
0.0018 |
exponential_vs_stationary_24light | 0.000581 | -1.09 |
| Thaps_hclust_0122 |
|
|
0.0000037 |
0.061 |
0.0018 |
lowN_TMEVA | 0.001190 | 0.947 |
| Thaps_hclust_0122 |
|
|
0.0000037 |
0.061 |
0.0018 |
diel_exponential_vs_stationary | 0.000602 | -1.5 |
| Thaps_hclust_0122 |
|
|
0.0000037 |
0.061 |
0.0018 |
lowSi_TMEVA | 0.590000 | -0.33 |
| Thaps_hclust_0122 |
|
|
0.0000037 |
0.061 |
0.0018 |
highlight_arrays | 0.000442 | 0.655 |
| Title | Cluster Plot | Dendrogram | e-value | e-value | e-value | Condition | Condition FDR | Condition Difference |
|---|---|---|---|---|---|---|---|---|
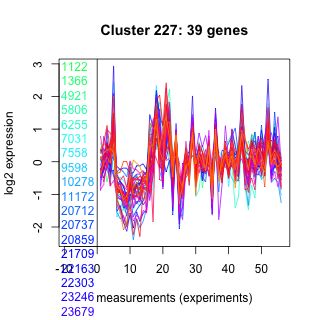
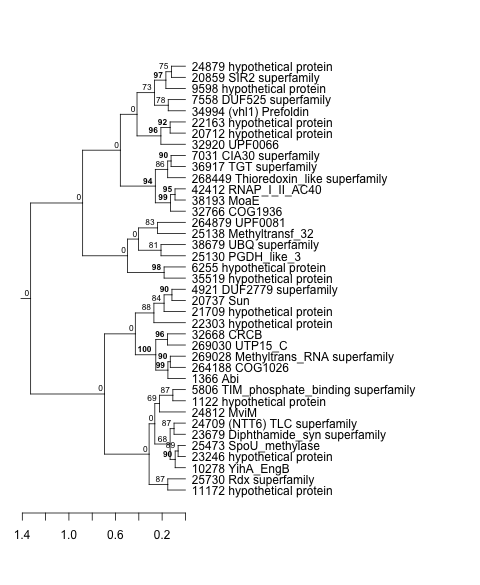
| Thaps_hclust_0227 |
 |
 |
1.2e-22 |
0.0000000098 |
0.0018 |
lowFe_TMEVA | 0.975000 | 0.0176 |
| Thaps_hclust_0227 |
|
|
1.2e-22 |
0.0000000098 |
0.0018 |
exponential_vs_stationary_24light | 0.365000 | -0.238 |
| Thaps_hclust_0227 |
|
|
1.2e-22 |
0.0000000098 |
0.0018 |
lowN_TMEVA | 0.356000 | 0.263 |
| Thaps_hclust_0227 |
|
|
1.2e-22 |
0.0000000098 |
0.0018 |
diel_exponential_vs_stationary | 0.454000 | -0.108 |
| Thaps_hclust_0227 |
|
|
1.2e-22 |
0.0000000098 |
0.0018 |
lowSi_TMEVA | 1.000000 | 0.0332 |
| Thaps_hclust_0227 |
|
|
1.2e-22 |
0.0000000098 |
0.0018 |
highlight_arrays | 0.803000 | -0.0342 |
| Thaps_hclust_0227 |
|
|
1.2e-22 |
0.0000000098 |
0.0018 |
diel_light_vs_dark | 0.184000 | -0.199 |
| Thaps_hclust_0227 |
|
|
1.2e-22 |
0.0000000098 |
0.0018 |
lowFe_KTKB_Day3 | 0.524000 | 0.122 |
| Thaps_hclust_0227 |
|
|
1.2e-22 |
0.0000000098 |
0.0018 |
lowFe_KTKB_Day5 | 0.017400 | 0.319 |
| Thaps_hclust_0227 |
|
|
1.2e-22 |
0.0000000098 |
0.0018 |
BaP | 0.000370 | 0.798 |
| Title | Cluster Plot | Dendrogram | e-value | e-value | e-value | Condition | Condition FDR | Condition Difference |
|---|---|---|---|---|---|---|---|---|
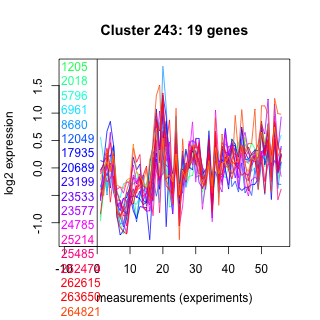
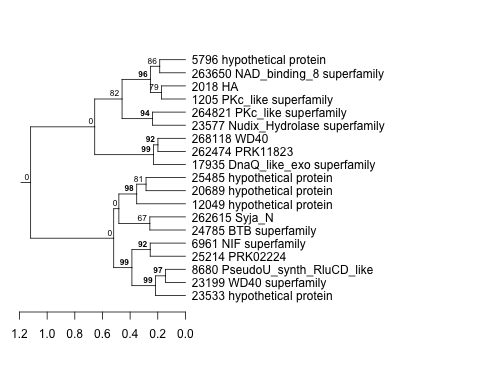
| Thaps_hclust_0243 |
 |
 |
0.00018 |
0.14 |
0.0019 |
lowFe_KTKB_Day5 | 0.719000 | -0.0822 |
| Thaps_hclust_0243 |
|
|
0.00018 |
0.14 |
0.0019 |
BaP | 0.080100 | 0.384 |
| Thaps_hclust_0243 |
|
|
0.00018 |
0.14 |
0.0019 |
exponential_vs_stationary_24highlight | 0.498000 | -0.0804 |
| Thaps_hclust_0243 |
|
|
0.00018 |
0.14 |
0.0019 |
co2_elevated_stat_arrays | 0.953000 | -0.0142 |
| Thaps_hclust_0243 |
|
|
0.00018 |
0.14 |
0.0019 |
lowtemp_TMEVA | 0.923000 | 0.0349 |
| Thaps_hclust_0243 |
|
|
0.00018 |
0.14 |
0.0019 |
highpH_TMEVA | 0.035300 | -0.345 |
| Thaps_hclust_0243 |
|
|
0.00018 |
0.14 |
0.0019 |
co2_elevated_expo_arrays | 0.934000 | 0.0423 |
| Thaps_hclust_0243 |
|
|
0.00018 |
0.14 |
0.0019 |
lowFe_TMEVA | 0.783000 | -0.108 |
| Thaps_hclust_0243 |
|
|
0.00018 |
0.14 |
0.0019 |
exponential_vs_stationary_24light | 0.142000 | -0.461 |
| Thaps_hclust_0243 |
|
|
0.00018 |
0.14 |
0.0019 |
lowN_TMEVA | 0.995000 | 0.00676 |
| Thaps_hclust_0243 |
|
|
0.00018 |
0.14 |
0.0019 |
diel_exponential_vs_stationary | 0.245000 | -0.214 |
| Thaps_hclust_0243 |
|
|
0.00018 |
0.14 |
0.0019 |
lowSi_TMEVA | 1.000000 | 0.0645 |
| Thaps_hclust_0243 |
|
|
0.00018 |
0.14 |
0.0019 |
highlight_arrays | 0.516000 | -0.115 |
| Thaps_hclust_0243 |
|
|
0.00018 |
0.14 |
0.0019 |
diel_light_vs_dark | 0.130000 | -0.321 |
| Thaps_hclust_0243 |
|
|
0.00018 |
0.14 |
0.0019 |
lowFe_KTKB_Day3 | 0.089300 | -0.406 |
| Title | Cluster Plot | Dendrogram | e-value | e-value | e-value | Condition | Condition FDR | Condition Difference |
|---|---|---|---|---|---|---|---|---|
| Thaps_hclust_0023 |
 |
 |
0.000000000039 |
0.0000072 |
0.002 |
lowFe_TMEVA | 0.001040 | -1.68 |
| Thaps_hclust_0023 |
|
|
0.000000000039 |
0.0000072 |
0.002 |
exponential_vs_stationary_24light | 0.000581 | 1.5 |
| Thaps_hclust_0023 |
|
|
0.000000000039 |
0.0000072 |
0.002 |
lowN_TMEVA | 0.001190 | -2.82 |
| Thaps_hclust_0023 |
|
|
0.000000000039 |
0.0000072 |
0.002 |
diel_exponential_vs_stationary | 0.000602 | 0.941 |
| Thaps_hclust_0023 |
|
|
0.000000000039 |
0.0000072 |
0.002 |
lowSi_TMEVA | 0.001350 | -2.52 |
| Thaps_hclust_0023 |
|
|
0.000000000039 |
0.0000072 |
0.002 |
highlight_arrays | 0.000442 | -0.846 |
| Thaps_hclust_0023 |
|
|
0.000000000039 |
0.0000072 |
0.002 |
diel_light_vs_dark | 0.000485 | -0.503 |
| Thaps_hclust_0023 |
|
|
0.000000000039 |
0.0000072 |
0.002 |
lowFe_KTKB_Day3 | 0.000862 | 1.28 |
| Thaps_hclust_0023 |
|
|
0.000000000039 |
0.0000072 |
0.002 |
lowFe_KTKB_Day5 | 0.001320 | 0.499 |
| Thaps_hclust_0023 |
|
|
0.000000000039 |
0.0000072 |
0.002 |
BaP | 0.192000 | -0.227 |
| Thaps_hclust_0023 |
|
|
0.000000000039 |
0.0000072 |
0.002 |
exponential_vs_stationary_24highlight | 0.000526 | 0.399 |
| Thaps_hclust_0023 |
|
|
0.000000000039 |
0.0000072 |
0.002 |
co2_elevated_stat_arrays | 0.697000 | -0.101 |
| Thaps_hclust_0023 |
|
|
0.000000000039 |
0.0000072 |
0.002 |
lowtemp_TMEVA | 0.000735 | -1.23 |
| Thaps_hclust_0023 |
|
|
0.000000000039 |
0.0000072 |
0.002 |
highpH_TMEVA | 0.359000 | -0.123 |
| Thaps_hclust_0023 |
|
|
0.000000000039 |
0.0000072 |
0.002 |
co2_elevated_expo_arrays | 0.759000 | 0.0841 |
| Title | Cluster Plot | Dendrogram | e-value | e-value | e-value | Condition | Condition FDR | Condition Difference |
|---|---|---|---|---|---|---|---|---|
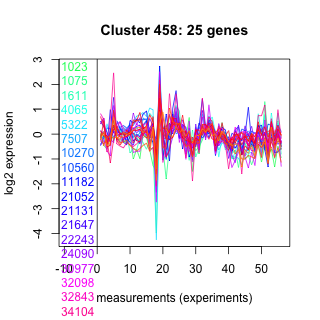
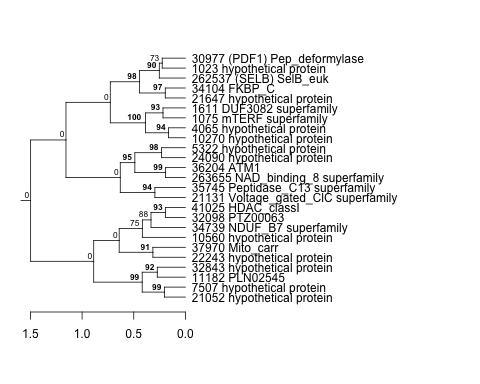
| Thaps_hclust_0458 |
 |
 |
0.0000000041 |
0.000000022 |
0.0024 |
co2_elevated_stat_arrays | 0.574000 | -0.139 |
| Thaps_hclust_0458 |
|
|
0.0000000041 |
0.000000022 |
0.0024 |
lowtemp_TMEVA | 0.037300 | 0.466 |
| Thaps_hclust_0458 |
|
|
0.0000000041 |
0.000000022 |
0.0024 |
highpH_TMEVA | 0.904000 | 0.0263 |
| Thaps_hclust_0458 |
|
|
0.0000000041 |
0.000000022 |
0.0024 |
co2_elevated_expo_arrays | 0.944000 | 0.0337 |
| Thaps_hclust_0458 |
|
|
0.0000000041 |
0.000000022 |
0.0024 |
lowFe_TMEVA | 0.911000 | 0.0423 |
| Thaps_hclust_0458 |
|
|
0.0000000041 |
0.000000022 |
0.0024 |
exponential_vs_stationary_24light | 0.055600 | 0.531 |
| Thaps_hclust_0458 |
|
|
0.0000000041 |
0.000000022 |
0.0024 |
lowN_TMEVA | 0.392000 | -0.282 |
| Thaps_hclust_0458 |
|
|
0.0000000041 |
0.000000022 |
0.0024 |
diel_exponential_vs_stationary | 0.002080 | 0.482 |
| Thaps_hclust_0458 |
|
|
0.0000000041 |
0.000000022 |
0.0024 |
lowSi_TMEVA | 0.976000 | -0.126 |
| Thaps_hclust_0458 |
|
|
0.0000000041 |
0.000000022 |
0.0024 |
highlight_arrays | 0.090000 | -0.242 |
| Thaps_hclust_0458 |
|
|
0.0000000041 |
0.000000022 |
0.0024 |
diel_light_vs_dark | 0.694000 | -0.0934 |
| Thaps_hclust_0458 |
|
|
0.0000000041 |
0.000000022 |
0.0024 |
lowFe_KTKB_Day3 | 0.810000 | -0.0599 |
| Thaps_hclust_0458 |
|
|
0.0000000041 |
0.000000022 |
0.0024 |
lowFe_KTKB_Day5 | 0.577000 | 0.111 |
| Thaps_hclust_0458 |
|
|
0.0000000041 |
0.000000022 |
0.0024 |
BaP | 0.398000 | -0.173 |
| Thaps_hclust_0458 |
|
|
0.0000000041 |
0.000000022 |
0.0024 |
exponential_vs_stationary_24highlight | 0.387000 | 0.0861 |
| Title | Cluster Plot | Dendrogram | e-value | e-value | e-value | Condition | Condition FDR | Condition Difference |
|---|---|---|---|---|---|---|---|---|
| Thaps_hclust_0146 |
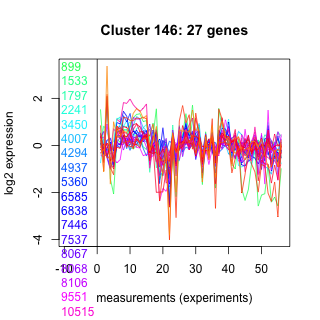 |
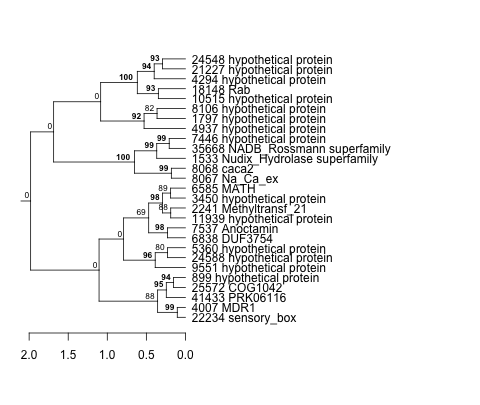 |
0.00000000081 |
0.000016 |
0.0025 |
exponential_vs_stationary_24light | 0.222000 | -0.343 |
| Thaps_hclust_0146 |
|
|
0.00000000081 |
0.000016 |
0.0025 |
lowN_TMEVA | 0.130000 | 0.424 |
| Thaps_hclust_0146 |
|
|
0.00000000081 |
0.000016 |
0.0025 |
diel_exponential_vs_stationary | 0.000602 | -0.632 |
| Thaps_hclust_0146 |
|
|
0.00000000081 |
0.000016 |
0.0025 |
lowSi_TMEVA | 0.321000 | -0.445 |
| Thaps_hclust_0146 |
|
|
0.00000000081 |
0.000016 |
0.0025 |
highlight_arrays | 0.184000 | 0.186 |
| Thaps_hclust_0146 |
|
|
0.00000000081 |
0.000016 |
0.0025 |
diel_light_vs_dark | 0.000485 | 0.573 |
| Thaps_hclust_0146 |
|
|
0.00000000081 |
0.000016 |
0.0025 |
lowFe_KTKB_Day3 | 0.390000 | -0.187 |
| Thaps_hclust_0146 |
|
|
0.00000000081 |
0.000016 |
0.0025 |
lowFe_KTKB_Day5 | 0.684000 | 0.08 |
| Thaps_hclust_0146 |
|
|
0.00000000081 |
0.000016 |
0.0025 |
BaP | 0.010500 | -0.455 |
| Thaps_hclust_0146 |
|
|
0.00000000081 |
0.000016 |
0.0025 |
exponential_vs_stationary_24highlight | 0.180000 | -0.124 |
| Thaps_hclust_0146 |
|
|
0.00000000081 |
0.000016 |
0.0025 |
co2_elevated_stat_arrays | 0.748000 | 0.0839 |
| Thaps_hclust_0146 |
|
|
0.00000000081 |
0.000016 |
0.0025 |
lowtemp_TMEVA | 0.020400 | -0.495 |
| Thaps_hclust_0146 |
|
|
0.00000000081 |
0.000016 |
0.0025 |
highpH_TMEVA | 0.301000 | 0.15 |
| Thaps_hclust_0146 |
|
|
0.00000000081 |
0.000016 |
0.0025 |
co2_elevated_expo_arrays | 0.898000 | 0.0548 |
| Thaps_hclust_0146 |
|
|
0.00000000081 |
0.000016 |
0.0025 |
lowFe_TMEVA | 0.432000 | -0.201 |
| Title | Cluster Plot | Dendrogram | e-value | e-value | e-value | Condition | Condition FDR | Condition Difference |
|---|---|---|---|---|---|---|---|---|
| Thaps_hclust_0422 |
 |
 |
1.9 |
15 |
0.0027 |
exponential_vs_stationary_24highlight | 0.000526 | -0.705 |
| Thaps_hclust_0422 |
|
|
1.9 |
15 |
0.0027 |
co2_elevated_stat_arrays | 0.615000 | 0.128 |
| Thaps_hclust_0422 |
|
|
1.9 |
15 |
0.0027 |
lowtemp_TMEVA | 0.023300 | -0.561 |
| Thaps_hclust_0422 |
|
|
1.9 |
15 |
0.0027 |
highpH_TMEVA | 0.964000 | 0.015 |
| Thaps_hclust_0422 |
|
|
1.9 |
15 |
0.0027 |
co2_elevated_expo_arrays | 0.145000 | 0.212 |
| Thaps_hclust_0422 |
|
|
1.9 |
15 |
0.0027 |
lowFe_TMEVA | 0.216000 | -0.33 |
| Thaps_hclust_0422 |
|
|
1.9 |
15 |
0.0027 |
exponential_vs_stationary_24light | 0.000581 | -1.75 |
| Thaps_hclust_0422 |
|
|
1.9 |
15 |
0.0027 |
lowN_TMEVA | 0.052200 | 0.599 |
| Thaps_hclust_0422 |
|
|
1.9 |
15 |
0.0027 |
diel_exponential_vs_stationary | 0.000602 | -1.22 |
| Thaps_hclust_0422 |
|
|
1.9 |
15 |
0.0027 |
lowSi_TMEVA | 1.000000 | 0.0343 |
| Thaps_hclust_0422 |
|
|
1.9 |
15 |
0.0027 |
highlight_arrays | 0.000442 | 0.591 |
| Thaps_hclust_0422 |
|
|
1.9 |
15 |
0.0027 |
diel_light_vs_dark | 0.017700 | -0.434 |
| Thaps_hclust_0422 |
|
|
1.9 |
15 |
0.0027 |
lowFe_KTKB_Day3 | 0.000862 | -1.06 |
| Thaps_hclust_0422 |
|
|
1.9 |
15 |
0.0027 |
lowFe_KTKB_Day5 | 0.146000 | -0.278 |
| Thaps_hclust_0422 |
|
|
1.9 |
15 |
0.0027 |
BaP | 0.000370 | -1.17 |
| Title | Cluster Plot | Dendrogram | e-value | e-value | e-value | Condition | Condition FDR | Condition Difference |
|---|---|---|---|---|---|---|---|---|
| Thaps_hclust_0474 |
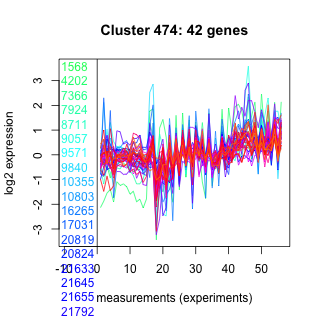 |
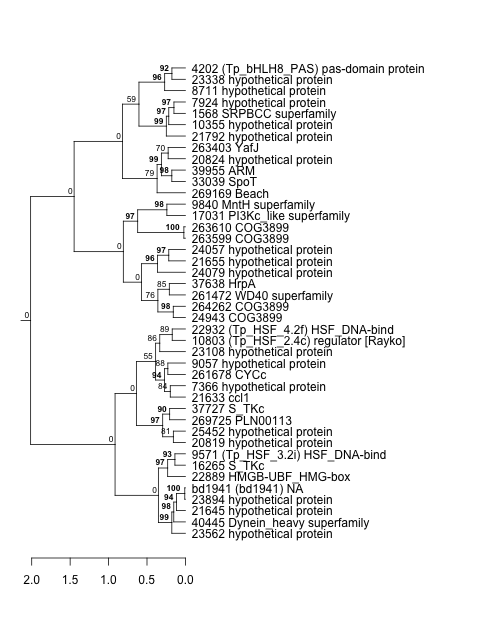 |
0.0078 |
0.000018 |
0.003 |
exponential_vs_stationary_24highlight | 0.000926 | -0.221 |
| Thaps_hclust_0474 |
|
|
0.0078 |
0.000018 |
0.003 |
co2_elevated_stat_arrays | 0.503000 | -0.147 |
| Thaps_hclust_0474 |
|
|
0.0078 |
0.000018 |
0.003 |
lowtemp_TMEVA | 0.024800 | -0.397 |
| Title | Cluster Plot | Dendrogram | e-value | e-value | e-value | Condition | Condition FDR | Condition Difference |
|---|---|---|---|---|---|---|---|---|
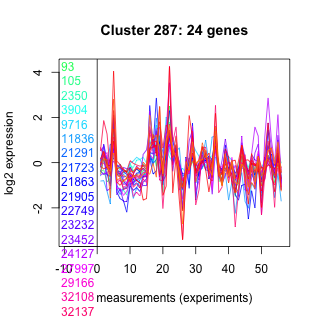
| Thaps_hclust_0287 |
 |
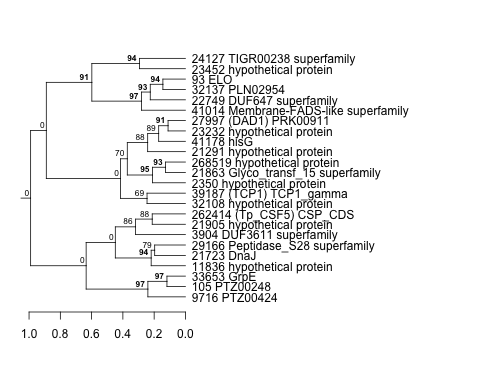 |
0.0000001 |
0.00007 |
0.003 |
exponential_vs_stationary_24light | 0.066000 | 0.527 |
| Thaps_hclust_0287 |
|
|
0.0000001 |
0.00007 |
0.003 |
lowN_TMEVA | 0.699000 | -0.146 |