Hierarchical Clusters
Displaying 201 - 300 of 7500
| Title | Cluster Plot | Dendrogram | e-value | e-value | e-value | Condition | Condition FDR | Condition Difference |
|---|---|---|---|---|---|---|---|---|
| Thaps_hclust_0063 |
 |
 |
9.8e-19 |
5.7e-17 |
8.2e-17 |
exponential_vs_stationary_24light | 0.006670 | 0.772 |
| Thaps_hclust_0063 |
|
|
9.8e-19 |
5.7e-17 |
8.2e-17 |
lowN_TMEVA | 0.730000 | -0.133 |
| Thaps_hclust_0063 |
|
|
9.8e-19 |
5.7e-17 |
8.2e-17 |
diel_exponential_vs_stationary | 0.002530 | 0.529 |
| Thaps_hclust_0063 |
|
|
9.8e-19 |
5.7e-17 |
8.2e-17 |
lowSi_TMEVA | 0.997000 | -0.0904 |
| Thaps_hclust_0063 |
|
|
9.8e-19 |
5.7e-17 |
8.2e-17 |
highlight_arrays | 0.000442 | -0.919 |
| Thaps_hclust_0063 |
|
|
9.8e-19 |
5.7e-17 |
8.2e-17 |
diel_light_vs_dark | 0.000485 | -1.49 |
| Thaps_hclust_0063 |
|
|
9.8e-19 |
5.7e-17 |
8.2e-17 |
lowFe_KTKB_Day3 | 0.000862 | -2.08 |
| Thaps_hclust_0063 |
|
|
9.8e-19 |
5.7e-17 |
8.2e-17 |
lowFe_KTKB_Day5 | 0.652000 | -0.0949 |
| Thaps_hclust_0063 |
|
|
9.8e-19 |
5.7e-17 |
8.2e-17 |
BaP | 0.343000 | 0.202 |
| Thaps_hclust_0063 |
|
|
9.8e-19 |
5.7e-17 |
8.2e-17 |
exponential_vs_stationary_24highlight | 0.000526 | 0.445 |
| Title | Cluster Plot | Dendrogram | e-value | e-value | e-value | Condition | Condition FDR | Condition Difference |
|---|---|---|---|---|---|---|---|---|
| Thaps_hclust_0082 |
 |
|
8.89825e-43 |
2e-27 |
1.3e-16 |
lowtemp_TMEVA | 1.000000 | -0.000692 |
| Thaps_hclust_0082 |
|
|
8.89825e-43 |
2e-27 |
1.3e-16 |
highpH_TMEVA | 0.000725 | -0.879 |
| Thaps_hclust_0082 |
|
|
8.89825e-43 |
2e-27 |
1.3e-16 |
co2_elevated_expo_arrays | 0.001390 | 1.09 |
| Thaps_hclust_0082 |
|
|
8.89825e-43 |
2e-27 |
1.3e-16 |
lowFe_TMEVA | 0.452000 | 0.152 |
| Thaps_hclust_0082 |
|
|
8.89825e-43 |
2e-27 |
1.3e-16 |
exponential_vs_stationary_24light | 0.000581 | 2.11 |
| Thaps_hclust_0082 |
|
|
8.89825e-43 |
2e-27 |
1.3e-16 |
lowN_TMEVA | 0.001190 | -0.512 |
| Thaps_hclust_0082 |
|
|
8.89825e-43 |
2e-27 |
1.3e-16 |
diel_exponential_vs_stationary | 0.170000 | 0.116 |
| Thaps_hclust_0082 |
|
|
8.89825e-43 |
2e-27 |
1.3e-16 |
lowSi_TMEVA | 0.001350 | -1.03 |
| Thaps_hclust_0082 |
|
|
8.89825e-43 |
2e-27 |
1.3e-16 |
highlight_arrays | 0.000442 | -0.807 |
| Thaps_hclust_0082 |
|
|
8.89825e-43 |
2e-27 |
1.3e-16 |
diel_light_vs_dark | 0.000485 | 1.67 |
| Thaps_hclust_0082 |
|
|
8.89825e-43 |
2e-27 |
1.3e-16 |
lowFe_KTKB_Day3 | 0.000862 | 0.987 |
| Thaps_hclust_0082 |
|
|
8.89825e-43 |
2e-27 |
1.3e-16 |
lowFe_KTKB_Day5 | 0.001320 | 0.728 |
| Thaps_hclust_0082 |
|
|
8.89825e-43 |
2e-27 |
1.3e-16 |
BaP | 0.824000 | -0.0268 |
| Thaps_hclust_0082 |
|
|
8.89825e-43 |
2e-27 |
1.3e-16 |
exponential_vs_stationary_24highlight | 0.000526 | 0.226 |
| Thaps_hclust_0082 |
|
|
8.89825e-43 |
2e-27 |
1.3e-16 |
co2_elevated_stat_arrays | 0.046800 | 0.253 |
| Title | Cluster Plot | Dendrogram | e-value | e-value | e-value | Condition | Condition FDR | Condition Difference |
|---|---|---|---|---|---|---|---|---|
| Thaps_hclust_0092 |
 |
|
1.3e-37 |
4.2e-20 |
0.0000000000000013 |
diel_light_vs_dark | 0.000485 | 1.49 |
| Thaps_hclust_0092 |
|
|
1.3e-37 |
4.2e-20 |
0.0000000000000013 |
lowFe_KTKB_Day3 | 0.000862 | 0.577 |
| Thaps_hclust_0092 |
|
|
1.3e-37 |
4.2e-20 |
0.0000000000000013 |
lowFe_KTKB_Day5 | 0.001320 | 0.343 |
| Thaps_hclust_0092 |
|
|
1.3e-37 |
4.2e-20 |
0.0000000000000013 |
BaP | 0.537000 | -0.0686 |
| Thaps_hclust_0092 |
|
|
1.3e-37 |
4.2e-20 |
0.0000000000000013 |
exponential_vs_stationary_24highlight | 0.722000 | -0.0199 |
| Thaps_hclust_0092 |
|
|
1.3e-37 |
4.2e-20 |
0.0000000000000013 |
co2_elevated_stat_arrays | 0.000658 | 1.24 |
| Thaps_hclust_0092 |
|
|
1.3e-37 |
4.2e-20 |
0.0000000000000013 |
lowtemp_TMEVA | 0.038100 | -0.246 |
| Thaps_hclust_0092 |
|
|
1.3e-37 |
4.2e-20 |
0.0000000000000013 |
highpH_TMEVA | 0.000725 | -0.895 |
| Thaps_hclust_0092 |
|
|
1.3e-37 |
4.2e-20 |
0.0000000000000013 |
co2_elevated_expo_arrays | 0.001390 | 1.11 |
| Thaps_hclust_0092 |
|
|
1.3e-37 |
4.2e-20 |
0.0000000000000013 |
lowFe_TMEVA | 0.766000 | 0.0993 |
| Thaps_hclust_0092 |
|
|
1.3e-37 |
4.2e-20 |
0.0000000000000013 |
exponential_vs_stationary_24light | 0.000581 | 1.99 |
| Thaps_hclust_0092 |
|
|
1.3e-37 |
4.2e-20 |
0.0000000000000013 |
lowN_TMEVA | 0.001190 | -0.464 |
| Thaps_hclust_0092 |
|
|
1.3e-37 |
4.2e-20 |
0.0000000000000013 |
diel_exponential_vs_stationary | 0.043600 | 0.159 |
| Thaps_hclust_0092 |
|
|
1.3e-37 |
4.2e-20 |
0.0000000000000013 |
lowSi_TMEVA | 0.001350 | -1.05 |
| Thaps_hclust_0092 |
|
|
1.3e-37 |
4.2e-20 |
0.0000000000000013 |
highlight_arrays | 0.000442 | -0.346 |
| Title | Cluster Plot | Dendrogram | e-value | e-value | e-value | Condition | Condition FDR | Condition Difference |
|---|---|---|---|---|---|---|---|---|
| Thaps_hclust_0336 |
 |
 |
8.7e-23 |
0.00000000000015 |
0.0000000000000032 |
diel_exponential_vs_stationary | 0.857000 | -0.0547 |
| Thaps_hclust_0336 |
|
|
8.7e-23 |
0.00000000000015 |
0.0000000000000032 |
lowSi_TMEVA | 0.983000 | 0.102 |
| Thaps_hclust_0336 |
|
|
8.7e-23 |
0.00000000000015 |
0.0000000000000032 |
highlight_arrays | 0.276000 | -0.234 |
| Thaps_hclust_0336 |
|
|
8.7e-23 |
0.00000000000015 |
0.0000000000000032 |
diel_light_vs_dark | 0.011200 | -0.688 |
| Thaps_hclust_0336 |
|
|
8.7e-23 |
0.00000000000015 |
0.0000000000000032 |
lowFe_KTKB_Day3 | 0.604000 | 0.174 |
| Thaps_hclust_0336 |
|
|
8.7e-23 |
0.00000000000015 |
0.0000000000000032 |
lowFe_KTKB_Day5 | 0.849000 | 0.0577 |
| Thaps_hclust_0336 |
|
|
8.7e-23 |
0.00000000000015 |
0.0000000000000032 |
BaP | 0.032100 | 0.618 |
| Thaps_hclust_0336 |
|
|
8.7e-23 |
0.00000000000015 |
0.0000000000000032 |
exponential_vs_stationary_24highlight | 0.362000 | -0.136 |
| Thaps_hclust_0336 |
|
|
8.7e-23 |
0.00000000000015 |
0.0000000000000032 |
co2_elevated_stat_arrays | 0.001700 | 0.801 |
| Thaps_hclust_0336 |
|
|
8.7e-23 |
0.00000000000015 |
0.0000000000000032 |
lowtemp_TMEVA | 0.584000 | 0.189 |
| Thaps_hclust_0336 |
|
|
8.7e-23 |
0.00000000000015 |
0.0000000000000032 |
highpH_TMEVA | 0.009260 | -0.561 |
| Thaps_hclust_0336 |
|
|
8.7e-23 |
0.00000000000015 |
0.0000000000000032 |
co2_elevated_expo_arrays | 0.002630 | 0.516 |
| Thaps_hclust_0336 |
|
|
8.7e-23 |
0.00000000000015 |
0.0000000000000032 |
lowFe_TMEVA | 0.331000 | -0.332 |
| Thaps_hclust_0336 |
|
|
8.7e-23 |
0.00000000000015 |
0.0000000000000032 |
exponential_vs_stationary_24light | 0.274000 | -0.445 |
| Thaps_hclust_0336 |
|
|
8.7e-23 |
0.00000000000015 |
0.0000000000000032 |
lowN_TMEVA | 0.532000 | 0.261 |
| Title | Cluster Plot | Dendrogram | e-value | e-value | e-value | Condition | Condition FDR | Condition Difference |
|---|---|---|---|---|---|---|---|---|
| Thaps_hclust_0028 |
 |
|
1.6e-27 |
6.8e-18 |
0.0000000000000078 |
BaP | 0.080000 | -0.197 |
| Thaps_hclust_0028 |
|
|
1.6e-27 |
6.8e-18 |
0.0000000000000078 |
exponential_vs_stationary_24highlight | 0.000526 | 0.591 |
| Thaps_hclust_0028 |
|
|
1.6e-27 |
6.8e-18 |
0.0000000000000078 |
co2_elevated_stat_arrays | 0.001190 | -0.393 |
| Thaps_hclust_0028 |
|
|
1.6e-27 |
6.8e-18 |
0.0000000000000078 |
lowtemp_TMEVA | 0.061100 | -0.254 |
| Thaps_hclust_0028 |
|
|
1.6e-27 |
6.8e-18 |
0.0000000000000078 |
highpH_TMEVA | 0.112000 | -0.152 |
| Thaps_hclust_0028 |
|
|
1.6e-27 |
6.8e-18 |
0.0000000000000078 |
co2_elevated_expo_arrays | 1.000000 | 0.00454 |
| Thaps_hclust_0028 |
|
|
1.6e-27 |
6.8e-18 |
0.0000000000000078 |
lowFe_TMEVA | 0.001040 | -0.401 |
| Thaps_hclust_0028 |
|
|
1.6e-27 |
6.8e-18 |
0.0000000000000078 |
exponential_vs_stationary_24light | 0.000581 | 1.51 |
| Thaps_hclust_0028 |
|
|
1.6e-27 |
6.8e-18 |
0.0000000000000078 |
lowN_TMEVA | 0.001190 | -0.933 |
| Thaps_hclust_0028 |
|
|
1.6e-27 |
6.8e-18 |
0.0000000000000078 |
diel_exponential_vs_stationary | 0.000602 | 0.543 |
| Thaps_hclust_0028 |
|
|
1.6e-27 |
6.8e-18 |
0.0000000000000078 |
lowSi_TMEVA | 0.001350 | -0.821 |
| Thaps_hclust_0028 |
|
|
1.6e-27 |
6.8e-18 |
0.0000000000000078 |
highlight_arrays | 0.000442 | -0.441 |
| Thaps_hclust_0028 |
|
|
1.6e-27 |
6.8e-18 |
0.0000000000000078 |
diel_light_vs_dark | 0.000485 | 0.467 |
| Thaps_hclust_0028 |
|
|
1.6e-27 |
6.8e-18 |
0.0000000000000078 |
lowFe_KTKB_Day3 | 0.859000 | -0.0308 |
| Thaps_hclust_0028 |
|
|
1.6e-27 |
6.8e-18 |
0.0000000000000078 |
lowFe_KTKB_Day5 | 0.908000 | 0.0157 |
| Title | Cluster Plot | Dendrogram | e-value | e-value | e-value | Condition | Condition FDR | Condition Difference |
|---|---|---|---|---|---|---|---|---|
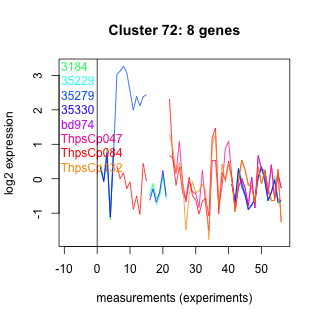
| Thaps_hclust_0072 |
 |
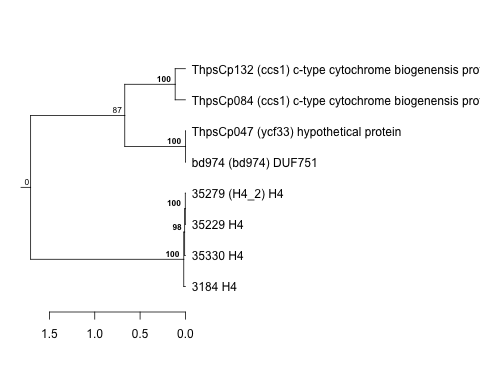 |
1.2e-22 |
1.1e-16 |
0.000000000000011 |
lowSi_TMEVA | 0.051200 | -1.14 |
| Thaps_hclust_0072 |
|
|
1.2e-22 |
1.1e-16 |
0.000000000000011 |
highlight_arrays | 0.502000 | -0.173 |
| Thaps_hclust_0072 |
|
|
1.2e-22 |
1.1e-16 |
0.000000000000011 |
diel_light_vs_dark | 0.629000 | -0.188 |
| Thaps_hclust_0072 |
|
|
1.2e-22 |
1.1e-16 |
0.000000000000011 |
lowFe_KTKB_Day3 | 0.157000 | -0.534 |
| Thaps_hclust_0072 |
|
|
1.2e-22 |
1.1e-16 |
0.000000000000011 |
lowFe_KTKB_Day5 | 0.501000 | -0.218 |
| Thaps_hclust_0072 |
|
|
1.2e-22 |
1.1e-16 |
0.000000000000011 |
BaP | 0.284000 | -0.374 |
| Thaps_hclust_0072 |
|
|
1.2e-22 |
1.1e-16 |
0.000000000000011 |
exponential_vs_stationary_24highlight | 0.035600 | 0.354 |
| Thaps_hclust_0072 |
|
|
1.2e-22 |
1.1e-16 |
0.000000000000011 |
co2_elevated_stat_arrays | 0.848000 | -0.0679 |
| Thaps_hclust_0072 |
|
|
1.2e-22 |
1.1e-16 |
0.000000000000011 |
lowtemp_TMEVA | 0.044600 | 0.856 |
| Thaps_hclust_0072 |
|
|
1.2e-22 |
1.1e-16 |
0.000000000000011 |
highpH_TMEVA | 0.131000 | 0.364 |
| Thaps_hclust_0072 |
|
|
1.2e-22 |
1.1e-16 |
0.000000000000011 |
co2_elevated_expo_arrays | 0.943000 | -0.0434 |
| Thaps_hclust_0072 |
|
|
1.2e-22 |
1.1e-16 |
0.000000000000011 |
lowFe_TMEVA | 0.899000 | -0.0587 |
| Thaps_hclust_0072 |
|
|
1.2e-22 |
1.1e-16 |
0.000000000000011 |
exponential_vs_stationary_24light | 0.547000 | 0.307 |
| Thaps_hclust_0072 |
|
|
1.2e-22 |
1.1e-16 |
0.000000000000011 |
lowN_TMEVA | 0.120000 | 0.766 |
| Thaps_hclust_0072 |
|
|
1.2e-22 |
1.1e-16 |
0.000000000000011 |
diel_exponential_vs_stationary | 0.079000 | 0.513 |
| Title | Cluster Plot | Dendrogram | e-value | e-value | e-value | Condition | Condition FDR | Condition Difference |
|---|---|---|---|---|---|---|---|---|
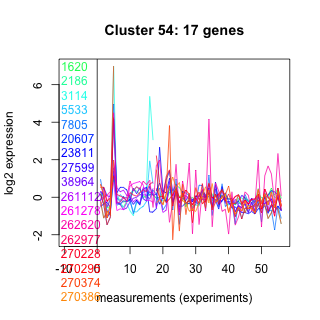
| Thaps_hclust_0054 |
 |
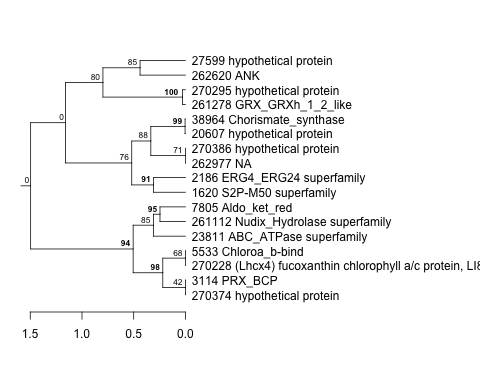 |
1.6e-17 |
0.0000000000053 |
0.000000000000024 |
lowSi_TMEVA | 0.372000 | -0.487 |
| Thaps_hclust_0054 |
|
|
1.6e-17 |
0.0000000000053 |
0.000000000000024 |
highlight_arrays | 0.244000 | -0.202 |
| Thaps_hclust_0054 |
|
|
1.6e-17 |
0.0000000000053 |
0.000000000000024 |
diel_light_vs_dark | 0.016000 | -0.509 |
| Thaps_hclust_0054 |
|
|
1.6e-17 |
0.0000000000053 |
0.000000000000024 |
lowFe_KTKB_Day3 | 0.001610 | 0.767 |
| Thaps_hclust_0054 |
|
|
1.6e-17 |
0.0000000000053 |
0.000000000000024 |
lowFe_KTKB_Day5 | 0.088000 | 0.367 |
| Thaps_hclust_0054 |
|
|
1.6e-17 |
0.0000000000053 |
0.000000000000024 |
BaP | 0.386000 | 0.215 |
| Thaps_hclust_0054 |
|
|
1.6e-17 |
0.0000000000053 |
0.000000000000024 |
exponential_vs_stationary_24highlight | 0.043700 | 0.228 |
| Thaps_hclust_0054 |
|
|
1.6e-17 |
0.0000000000053 |
0.000000000000024 |
co2_elevated_stat_arrays | 0.856000 | 0.0533 |
| Thaps_hclust_0054 |
|
|
1.6e-17 |
0.0000000000053 |
0.000000000000024 |
lowtemp_TMEVA | 0.000735 | 2.95 |
| Thaps_hclust_0054 |
|
|
1.6e-17 |
0.0000000000053 |
0.000000000000024 |
highpH_TMEVA | 0.358000 | 0.161 |
| Thaps_hclust_0054 |
|
|
1.6e-17 |
0.0000000000053 |
0.000000000000024 |
co2_elevated_expo_arrays | 0.985000 | 0.00824 |
| Thaps_hclust_0054 |
|
|
1.6e-17 |
0.0000000000053 |
0.000000000000024 |
lowFe_TMEVA | 0.813000 | -0.098 |
| Thaps_hclust_0054 |
|
|
1.6e-17 |
0.0000000000053 |
0.000000000000024 |
exponential_vs_stationary_24light | 0.084300 | 0.572 |
| Thaps_hclust_0054 |
|
|
1.6e-17 |
0.0000000000053 |
0.000000000000024 |
lowN_TMEVA | 0.051700 | -0.675 |
| Thaps_hclust_0054 |
|
|
1.6e-17 |
0.0000000000053 |
0.000000000000024 |
diel_exponential_vs_stationary | 0.097200 | 0.318 |