Hierarchical Clusters
Displaying 301 - 400 of 7500
| Title | Cluster Plot | Dendrogram | e-value | e-value | e-value | Condition | Condition FDR | Condition Difference |
|---|---|---|---|---|---|---|---|---|
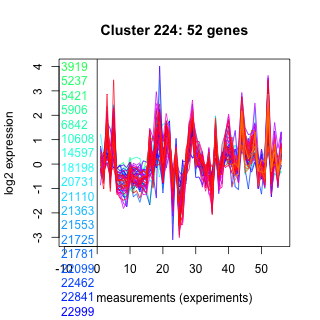
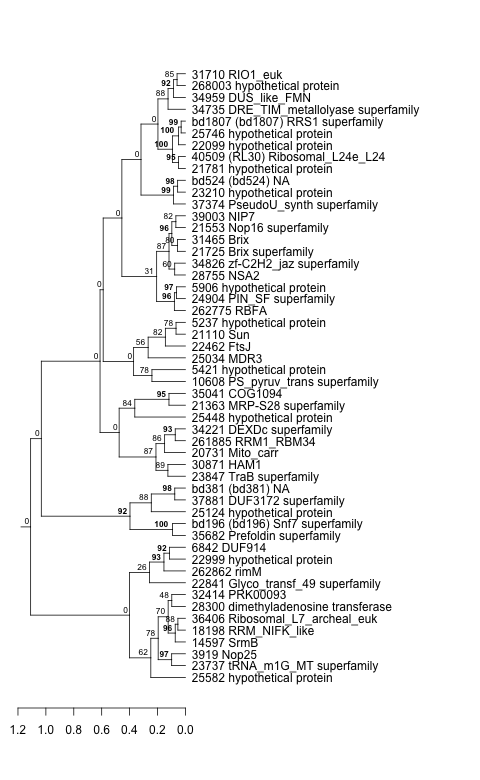
| Thaps_hclust_0224 |
 |
 |
9.3e-28 |
1.9e-21 |
0.046 |
co2_elevated_expo_arrays | 0.683000 | -0.0892 |
| Thaps_hclust_0224 |
|
|
9.3e-28 |
1.9e-21 |
0.046 |
lowFe_TMEVA | 0.382000 | -0.194 |
| Thaps_hclust_0224 |
|
|
9.3e-28 |
1.9e-21 |
0.046 |
exponential_vs_stationary_24light | 0.000581 | -1.22 |
| Thaps_hclust_0224 |
|
|
9.3e-28 |
1.9e-21 |
0.046 |
lowN_TMEVA | 0.001190 | 1.15 |
| Thaps_hclust_0224 |
|
|
9.3e-28 |
1.9e-21 |
0.046 |
diel_exponential_vs_stationary | 0.000602 | -0.76 |
| Thaps_hclust_0224 |
|
|
9.3e-28 |
1.9e-21 |
0.046 |
lowSi_TMEVA | 1.000000 | -0.0215 |
| Thaps_hclust_0224 |
|
|
9.3e-28 |
1.9e-21 |
0.046 |
highlight_arrays | 0.000442 | 0.362 |
| Thaps_hclust_0224 |
|
|
9.3e-28 |
1.9e-21 |
0.046 |
diel_light_vs_dark | 0.000485 | -0.635 |
| Thaps_hclust_0224 |
|
|
9.3e-28 |
1.9e-21 |
0.046 |
lowFe_KTKB_Day3 | 0.051000 | 0.267 |
| Thaps_hclust_0224 |
|
|
9.3e-28 |
1.9e-21 |
0.046 |
lowFe_KTKB_Day5 | 0.864000 | -0.0242 |
| Thaps_hclust_0224 |
|
|
9.3e-28 |
1.9e-21 |
0.046 |
BaP | 0.000370 | 0.783 |
| Thaps_hclust_0224 |
|
|
9.3e-28 |
1.9e-21 |
0.046 |
exponential_vs_stationary_24highlight | 0.000526 | -0.402 |
| Thaps_hclust_0224 |
|
|
9.3e-28 |
1.9e-21 |
0.046 |
co2_elevated_stat_arrays | 0.000658 | 1.17 |
| Thaps_hclust_0224 |
|
|
9.3e-28 |
1.9e-21 |
0.046 |
lowtemp_TMEVA | 0.000735 | 1.18 |
| Thaps_hclust_0224 |
|
|
9.3e-28 |
1.9e-21 |
0.046 |
highpH_TMEVA | 0.686000 | 0.0546 |
| Title | Cluster Plot | Dendrogram | e-value | e-value | e-value | Condition | Condition FDR | Condition Difference |
|---|---|---|---|---|---|---|---|---|
| Thaps_hclust_0028 |
 |
|
1.6e-27 |
6.8e-18 |
0.0000000000000078 |
lowtemp_TMEVA | 0.061100 | -0.254 |
| Thaps_hclust_0028 |
|
|
1.6e-27 |
6.8e-18 |
0.0000000000000078 |
highpH_TMEVA | 0.112000 | -0.152 |
| Thaps_hclust_0028 |
|
|
1.6e-27 |
6.8e-18 |
0.0000000000000078 |
co2_elevated_expo_arrays | 1.000000 | 0.00454 |
| Thaps_hclust_0028 |
|
|
1.6e-27 |
6.8e-18 |
0.0000000000000078 |
lowFe_TMEVA | 0.001040 | -0.401 |
| Thaps_hclust_0028 |
|
|
1.6e-27 |
6.8e-18 |
0.0000000000000078 |
exponential_vs_stationary_24light | 0.000581 | 1.51 |
| Thaps_hclust_0028 |
|
|
1.6e-27 |
6.8e-18 |
0.0000000000000078 |
lowN_TMEVA | 0.001190 | -0.933 |
| Thaps_hclust_0028 |
|
|
1.6e-27 |
6.8e-18 |
0.0000000000000078 |
diel_exponential_vs_stationary | 0.000602 | 0.543 |
| Thaps_hclust_0028 |
|
|
1.6e-27 |
6.8e-18 |
0.0000000000000078 |
lowSi_TMEVA | 0.001350 | -0.821 |
| Thaps_hclust_0028 |
|
|
1.6e-27 |
6.8e-18 |
0.0000000000000078 |
highlight_arrays | 0.000442 | -0.441 |
| Thaps_hclust_0028 |
|
|
1.6e-27 |
6.8e-18 |
0.0000000000000078 |
diel_light_vs_dark | 0.000485 | 0.467 |
| Thaps_hclust_0028 |
|
|
1.6e-27 |
6.8e-18 |
0.0000000000000078 |
lowFe_KTKB_Day3 | 0.859000 | -0.0308 |
| Thaps_hclust_0028 |
|
|
1.6e-27 |
6.8e-18 |
0.0000000000000078 |
lowFe_KTKB_Day5 | 0.908000 | 0.0157 |
| Thaps_hclust_0028 |
|
|
1.6e-27 |
6.8e-18 |
0.0000000000000078 |
BaP | 0.080000 | -0.197 |
| Thaps_hclust_0028 |
|
|
1.6e-27 |
6.8e-18 |
0.0000000000000078 |
exponential_vs_stationary_24highlight | 0.000526 | 0.591 |
| Thaps_hclust_0028 |
|
|
1.6e-27 |
6.8e-18 |
0.0000000000000078 |
co2_elevated_stat_arrays | 0.001190 | -0.393 |
| Title | Cluster Plot | Dendrogram | e-value | e-value | e-value | Condition | Condition FDR | Condition Difference |
|---|---|---|---|---|---|---|---|---|
| Thaps_hclust_0069 |
 |
 |
1.2e-26 |
2.6e-24 |
2.4e-20 |
lowN_TMEVA | 0.004000 | -0.621 |
| Thaps_hclust_0069 |
|
|
1.2e-26 |
2.6e-24 |
2.4e-20 |
diel_exponential_vs_stationary | 0.000602 | 1.82 |
| Thaps_hclust_0069 |
|
|
1.2e-26 |
2.6e-24 |
2.4e-20 |
lowSi_TMEVA | 0.296000 | -0.408 |
| Thaps_hclust_0069 |
|
|
1.2e-26 |
2.6e-24 |
2.4e-20 |
highlight_arrays | 0.000442 | -1.38 |
| Thaps_hclust_0069 |
|
|
1.2e-26 |
2.6e-24 |
2.4e-20 |
diel_light_vs_dark | 0.004510 | -0.384 |
| Thaps_hclust_0069 |
|
|
1.2e-26 |
2.6e-24 |
2.4e-20 |
lowFe_KTKB_Day3 | 0.463000 | -0.129 |
| Thaps_hclust_0069 |
|
|
1.2e-26 |
2.6e-24 |
2.4e-20 |
lowFe_KTKB_Day5 | 0.059800 | -0.251 |
| Thaps_hclust_0069 |
|
|
1.2e-26 |
2.6e-24 |
2.4e-20 |
BaP | 0.492000 | -0.111 |
| Thaps_hclust_0069 |
|
|
1.2e-26 |
2.6e-24 |
2.4e-20 |
exponential_vs_stationary_24highlight | 0.000526 | 0.306 |
| Thaps_hclust_0069 |
|
|
1.2e-26 |
2.6e-24 |
2.4e-20 |
co2_elevated_stat_arrays | 0.000658 | 0.711 |
| Thaps_hclust_0069 |
|
|
1.2e-26 |
2.6e-24 |
2.4e-20 |
lowtemp_TMEVA | 0.041200 | -0.347 |
| Thaps_hclust_0069 |
|
|
1.2e-26 |
2.6e-24 |
2.4e-20 |
highpH_TMEVA | 0.000725 | -0.819 |
| Thaps_hclust_0069 |
|
|
1.2e-26 |
2.6e-24 |
2.4e-20 |
co2_elevated_expo_arrays | 0.660000 | 0.0935 |
| Thaps_hclust_0069 |
|
|
1.2e-26 |
2.6e-24 |
2.4e-20 |
lowFe_TMEVA | 0.001040 | -0.729 |
| Thaps_hclust_0069 |
|
|
1.2e-26 |
2.6e-24 |
2.4e-20 |
exponential_vs_stationary_24light | 0.000581 | 2.1 |
| Title | Cluster Plot | Dendrogram | e-value | e-value | e-value | Condition | Condition FDR | Condition Difference |
|---|---|---|---|---|---|---|---|---|
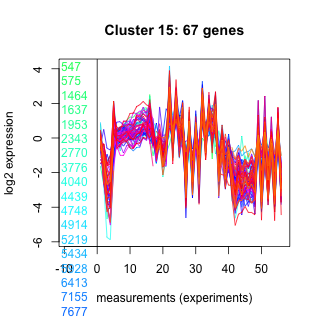
| Thaps_hclust_0015 |
 |
|
2.5e-25 |
7.4e-21 |
0.0000000011 |
exponential_vs_stationary_24light | 0.000581 | 2.9 |
| Thaps_hclust_0015 |
|
|
2.5e-25 |
7.4e-21 |
0.0000000011 |
lowN_TMEVA | 0.001190 | -2.83 |
| Thaps_hclust_0015 |
|
|
2.5e-25 |
7.4e-21 |
0.0000000011 |
diel_exponential_vs_stationary | 0.000602 | 1.97 |
| Thaps_hclust_0015 |
|
|
2.5e-25 |
7.4e-21 |
0.0000000011 |
lowSi_TMEVA | 0.001350 | -2.9 |
| Thaps_hclust_0015 |
|
|
2.5e-25 |
7.4e-21 |
0.0000000011 |
highlight_arrays | 0.000442 | -1.29 |
| Thaps_hclust_0015 |
|
|
2.5e-25 |
7.4e-21 |
0.0000000011 |
diel_light_vs_dark | 0.000485 | -1.64 |
| Thaps_hclust_0015 |
|
|
2.5e-25 |
7.4e-21 |
0.0000000011 |
lowFe_KTKB_Day3 | 0.000862 | 0.949 |
| Thaps_hclust_0015 |
|
|
2.5e-25 |
7.4e-21 |
0.0000000011 |
lowFe_KTKB_Day5 | 0.249000 | 0.128 |
| Thaps_hclust_0015 |
|
|
2.5e-25 |
7.4e-21 |
0.0000000011 |
BaP | 0.000370 | -0.519 |
| Thaps_hclust_0015 |
|
|
2.5e-25 |
7.4e-21 |
0.0000000011 |
exponential_vs_stationary_24highlight | 0.000526 | 0.508 |
| Thaps_hclust_0015 |
|
|
2.5e-25 |
7.4e-21 |
0.0000000011 |
co2_elevated_stat_arrays | 0.125000 | 0.239 |
| Thaps_hclust_0015 |
|
|
2.5e-25 |
7.4e-21 |
0.0000000011 |
lowtemp_TMEVA | 0.012000 | 0.362 |
| Thaps_hclust_0015 |
|
|
2.5e-25 |
7.4e-21 |
0.0000000011 |
highpH_TMEVA | 0.000725 | -0.331 |
| Thaps_hclust_0015 |
|
|
2.5e-25 |
7.4e-21 |
0.0000000011 |
co2_elevated_expo_arrays | 0.250000 | 0.129 |
| Thaps_hclust_0015 |
|
|
2.5e-25 |
7.4e-21 |
0.0000000011 |
lowFe_TMEVA | 0.001040 | -1.31 |
| Title | Cluster Plot | Dendrogram | e-value | e-value | e-value | Condition | Condition FDR | Condition Difference |
|---|---|---|---|---|---|---|---|---|
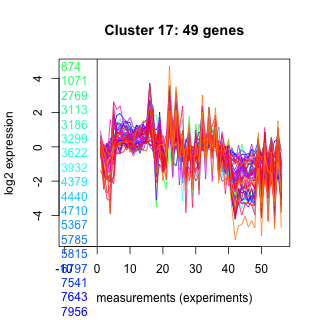
| Thaps_hclust_0017 |
 |
 |
4.6e-24 |
0.00000000000046 |
0.000000000000098 |
diel_exponential_vs_stationary | 0.000602 | 1.06 |
| Thaps_hclust_0017 |
|
|
4.6e-24 |
0.00000000000046 |
0.000000000000098 |
lowSi_TMEVA | 0.001350 | -1.05 |
| Thaps_hclust_0017 |
|
|
4.6e-24 |
0.00000000000046 |
0.000000000000098 |
highlight_arrays | 0.000442 | -0.678 |
| Thaps_hclust_0017 |
|
|
4.6e-24 |
0.00000000000046 |
0.000000000000098 |
diel_light_vs_dark | 0.000485 | -0.939 |
| Thaps_hclust_0017 |
|
|
4.6e-24 |
0.00000000000046 |
0.000000000000098 |
lowFe_KTKB_Day3 | 0.000862 | 1.67 |
| Thaps_hclust_0017 |
|
|
4.6e-24 |
0.00000000000046 |
0.000000000000098 |
lowFe_KTKB_Day5 | 0.001320 | 0.772 |
| Thaps_hclust_0017 |
|
|
4.6e-24 |
0.00000000000046 |
0.000000000000098 |
BaP | 0.022800 | -0.302 |
| Thaps_hclust_0017 |
|
|
4.6e-24 |
0.00000000000046 |
0.000000000000098 |
exponential_vs_stationary_24highlight | 0.000526 | 0.31 |
| Thaps_hclust_0017 |
|
|
4.6e-24 |
0.00000000000046 |
0.000000000000098 |
co2_elevated_stat_arrays | 0.064400 | 0.292 |
| Thaps_hclust_0017 |
|
|
4.6e-24 |
0.00000000000046 |
0.000000000000098 |
lowtemp_TMEVA | 0.297000 | 0.177 |
| Thaps_hclust_0017 |
|
|
4.6e-24 |
0.00000000000046 |
0.000000000000098 |
highpH_TMEVA | 0.851000 | -0.0286 |
| Thaps_hclust_0017 |
|
|
4.6e-24 |
0.00000000000046 |
0.000000000000098 |
co2_elevated_expo_arrays | 0.025000 | 0.206 |
| Thaps_hclust_0017 |
|
|
4.6e-24 |
0.00000000000046 |
0.000000000000098 |
lowFe_TMEVA | 0.001040 | -0.751 |
| Thaps_hclust_0017 |
|
|
4.6e-24 |
0.00000000000046 |
0.000000000000098 |
exponential_vs_stationary_24light | 0.000581 | 1.74 |
| Thaps_hclust_0017 |
|
|
4.6e-24 |
0.00000000000046 |
0.000000000000098 |
lowN_TMEVA | 0.001190 | -0.978 |
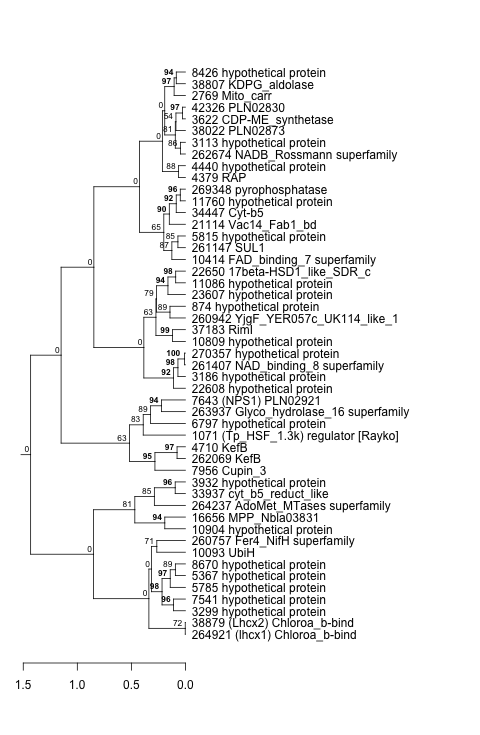
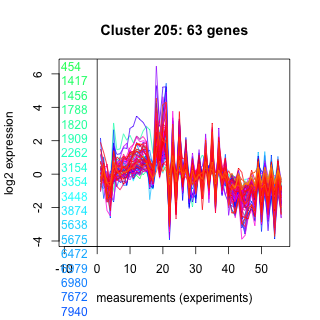
| Title | Cluster Plot | Dendrogram | e-value | e-value | e-value | Condition | Condition FDR | Condition Difference |
|---|---|---|---|---|---|---|---|---|
| Thaps_hclust_0205 |
 |
 |
2.3e-23 |
7.6e-16 |
0.00000015 |
highpH_TMEVA | 0.300000 | 0.11 |
| Thaps_hclust_0205 |
|
|
2.3e-23 |
7.6e-16 |
0.00000015 |
co2_elevated_expo_arrays | 0.282000 | 0.129 |
| Thaps_hclust_0205 |
|
|
2.3e-23 |
7.6e-16 |
0.00000015 |
lowFe_TMEVA | 0.810000 | 0.0887 |
| Thaps_hclust_0205 |
|
|
2.3e-23 |
7.6e-16 |
0.00000015 |
exponential_vs_stationary_24light | 0.000581 | 1.39 |
| Thaps_hclust_0205 |
|
|
2.3e-23 |
7.6e-16 |
0.00000015 |
lowN_TMEVA | 0.001190 | -0.696 |
| Thaps_hclust_0205 |
|
|
2.3e-23 |
7.6e-16 |
0.00000015 |
diel_exponential_vs_stationary | 0.914000 | 0.0153 |
| Thaps_hclust_0205 |
|
|
2.3e-23 |
7.6e-16 |
0.00000015 |
lowSi_TMEVA | 0.001350 | -0.925 |
| Thaps_hclust_0205 |
|
|
2.3e-23 |
7.6e-16 |
0.00000015 |
highlight_arrays | 0.000442 | -0.427 |
| Thaps_hclust_0205 |
|
|
2.3e-23 |
7.6e-16 |
0.00000015 |
diel_light_vs_dark | 0.000485 | 1.62 |
| Thaps_hclust_0205 |
|
|
2.3e-23 |
7.6e-16 |
0.00000015 |
lowFe_KTKB_Day3 | 0.453000 | 0.11 |
| Thaps_hclust_0205 |
|
|
2.3e-23 |
7.6e-16 |
0.00000015 |
lowFe_KTKB_Day5 | 0.978000 | 0.00427 |
| Thaps_hclust_0205 |
|
|
2.3e-23 |
7.6e-16 |
0.00000015 |
BaP | 0.000370 | 1.87 |
| Thaps_hclust_0205 |
|
|
2.3e-23 |
7.6e-16 |
0.00000015 |
exponential_vs_stationary_24highlight | 0.000526 | 0.396 |
| Thaps_hclust_0205 |
|
|
2.3e-23 |
7.6e-16 |
0.00000015 |
co2_elevated_stat_arrays | 0.778000 | -0.0836 |
| Thaps_hclust_0205 |
|
|
2.3e-23 |
7.6e-16 |
0.00000015 |
lowtemp_TMEVA | 0.012000 | 0.371 |
| Title | Cluster Plot | Dendrogram | e-value | e-value | e-value | Condition | Condition FDR | Condition Difference |
|---|---|---|---|---|---|---|---|---|
| Thaps_hclust_0336 |
 |
 |
8.7e-23 |
0.00000000000015 |
0.0000000000000032 |
lowSi_TMEVA | 0.983000 | 0.102 |
| Thaps_hclust_0336 |
|
|
8.7e-23 |
0.00000000000015 |
0.0000000000000032 |
highlight_arrays | 0.276000 | -0.234 |
| Thaps_hclust_0336 |
|
|
8.7e-23 |
0.00000000000015 |
0.0000000000000032 |
diel_light_vs_dark | 0.011200 | -0.688 |
| Thaps_hclust_0336 |
|
|
8.7e-23 |
0.00000000000015 |
0.0000000000000032 |
lowFe_KTKB_Day3 | 0.604000 | 0.174 |
| Thaps_hclust_0336 |
|
|
8.7e-23 |
0.00000000000015 |
0.0000000000000032 |
lowFe_KTKB_Day5 | 0.849000 | 0.0577 |
| Thaps_hclust_0336 |
|
|
8.7e-23 |
0.00000000000015 |
0.0000000000000032 |
BaP | 0.032100 | 0.618 |
| Thaps_hclust_0336 |
|
|
8.7e-23 |
0.00000000000015 |
0.0000000000000032 |
exponential_vs_stationary_24highlight | 0.362000 | -0.136 |
| Thaps_hclust_0336 |
|
|
8.7e-23 |
0.00000000000015 |
0.0000000000000032 |
co2_elevated_stat_arrays | 0.001700 | 0.801 |
| Thaps_hclust_0336 |
|
|
8.7e-23 |
0.00000000000015 |
0.0000000000000032 |
lowtemp_TMEVA | 0.584000 | 0.189 |
| Thaps_hclust_0336 |
|
|
8.7e-23 |
0.00000000000015 |
0.0000000000000032 |
highpH_TMEVA | 0.009260 | -0.561 |