Hierarchical Clusters
Displaying 301 - 400 of 7500
| Title | Cluster Plot | Dendrogram | e-value | e-value | e-value | Condition | Condition FDR | Condition Difference |
|---|---|---|---|---|---|---|---|---|
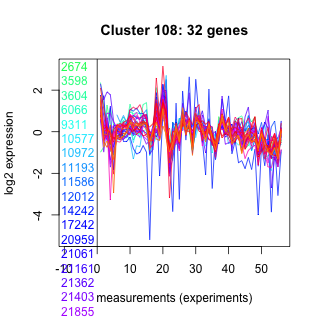
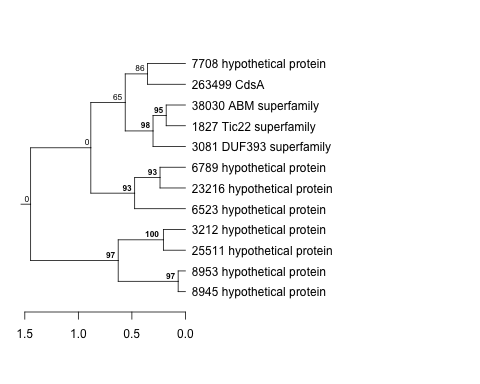
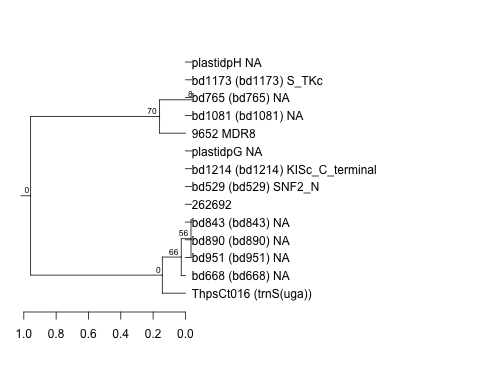
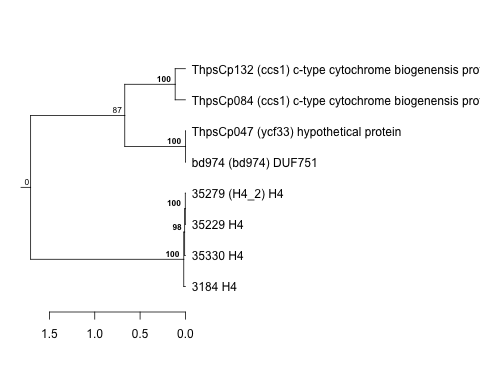
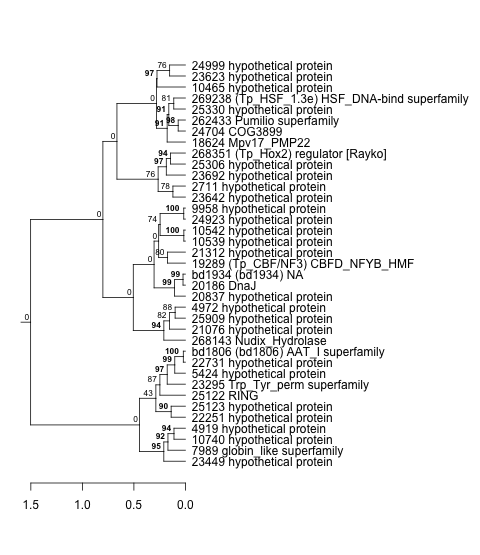
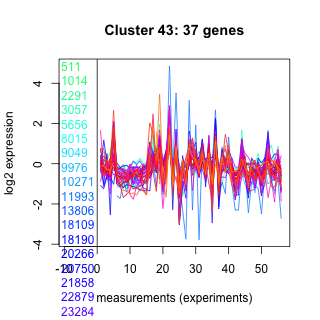
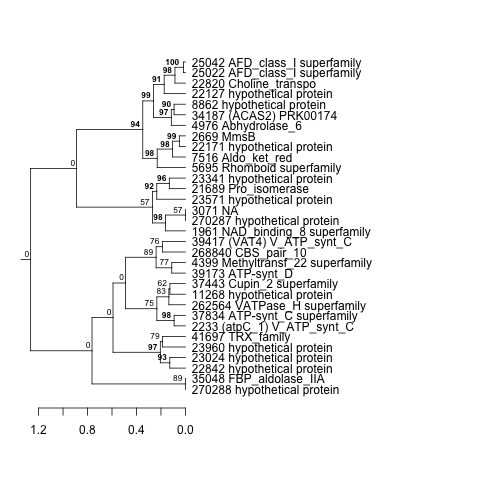
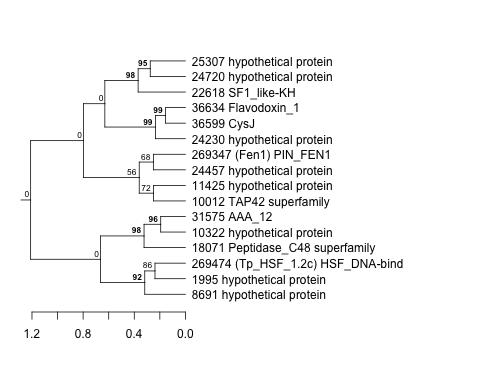
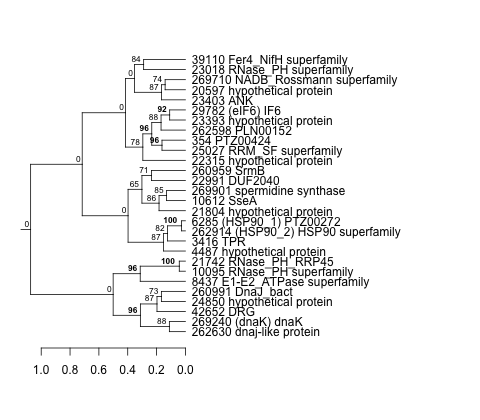
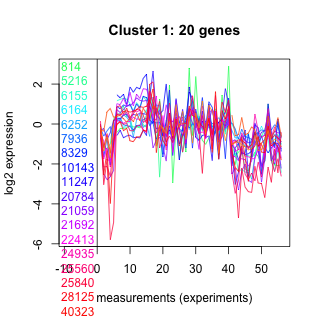
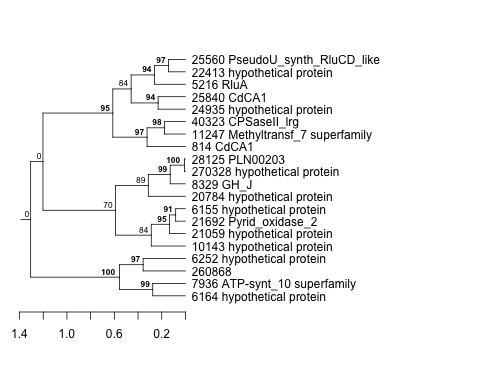
| Thaps_hclust_0108 |
 |
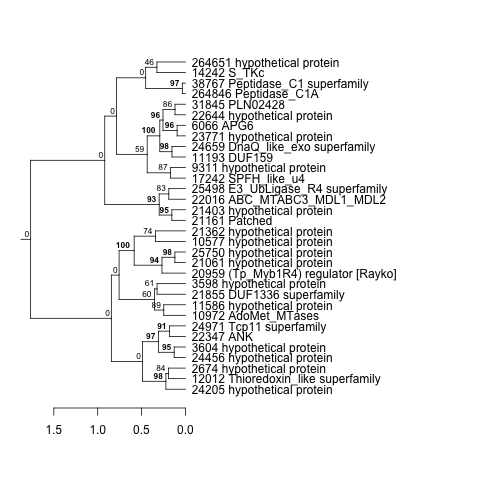 |
0.0000001 |
0.013 |
4 |
BaP | 0.000370 | 0.837 |
| Title | Cluster Plot | Dendrogram | e-value | e-value | e-value | Condition | Condition FDR | Condition Difference |
|---|---|---|---|---|---|---|---|---|
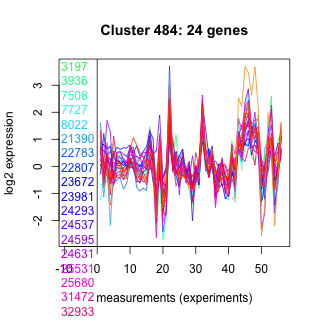
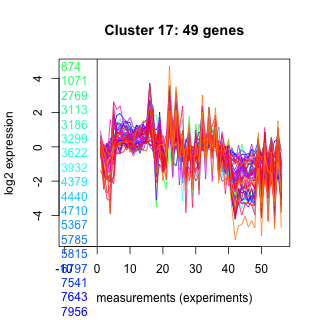
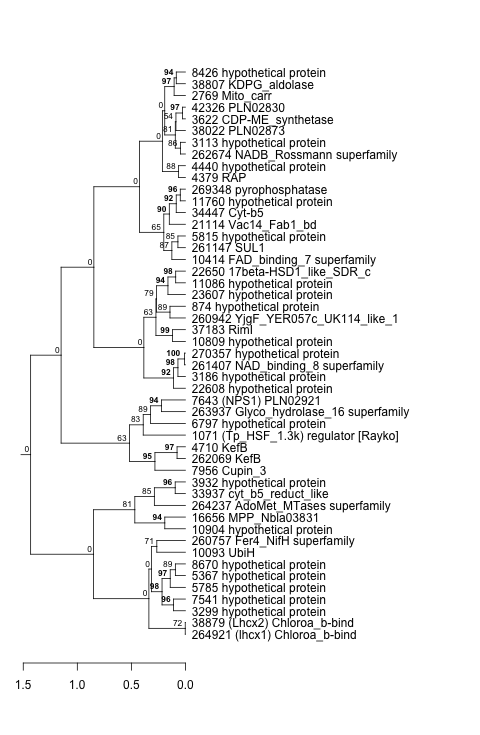
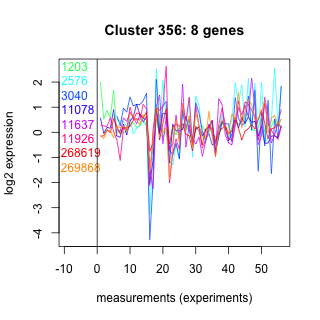
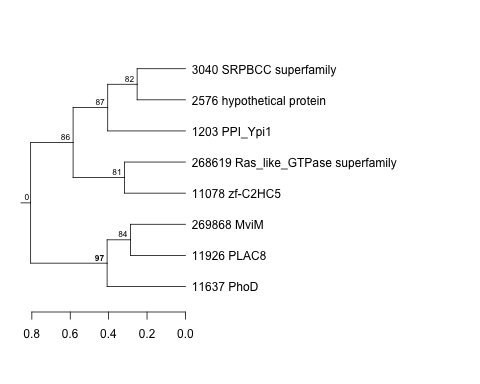
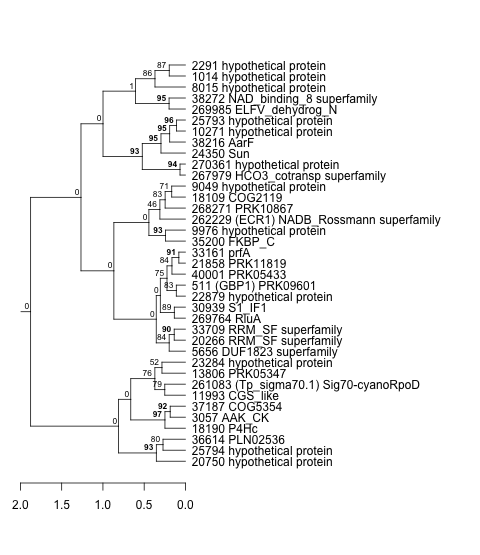
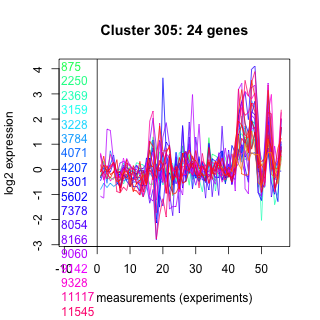
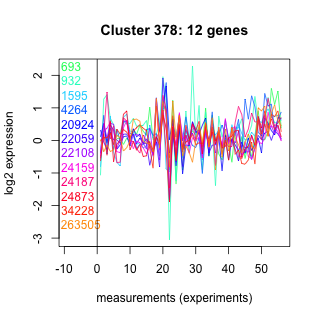
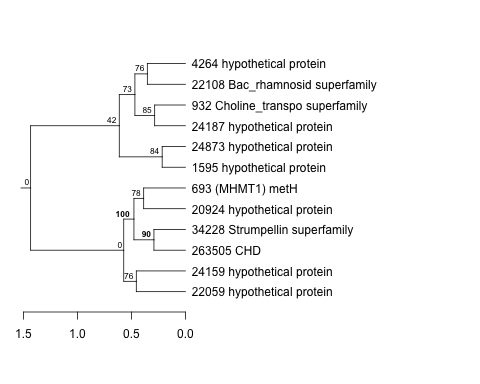
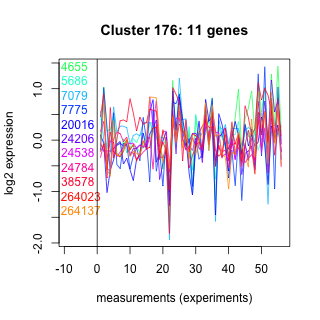
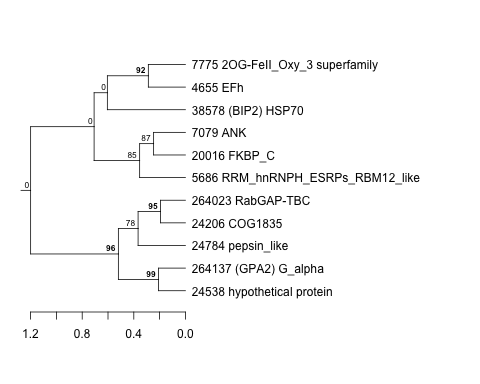
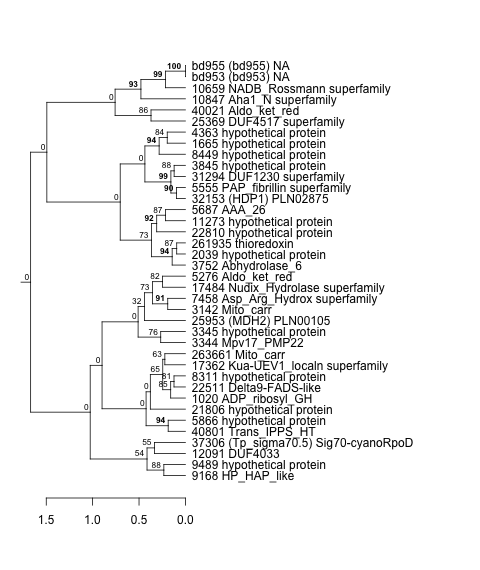
| Thaps_hclust_0484 |
 |
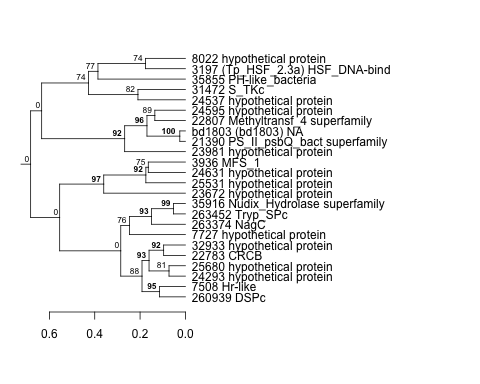 |
0.024 |
0.26 |
5.1 |
co2_elevated_stat_arrays | 0.000658 | 0.836 |
| Thaps_hclust_0484 |
|
|
0.024 |
0.26 |
5.1 |
diel_exponential_vs_stationary | 0.000602 | 0.808 |
| Title | Cluster Plot | Dendrogram | e-value | e-value | e-value | Condition | Condition FDR | Condition Difference |
|---|---|---|---|---|---|---|---|---|
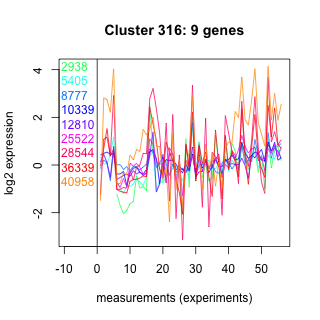
| Thaps_hclust_0316 |
 |
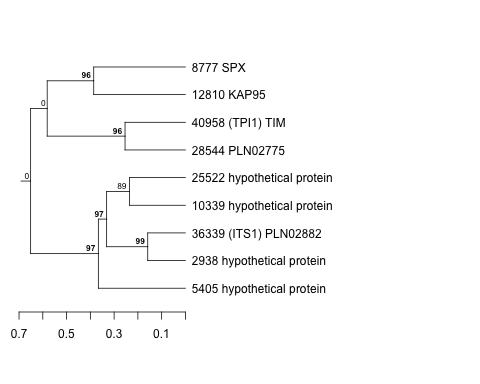 |
0.14 |
2.2 |
4.4 |
diel_light_vs_dark | 0.005770 | 0.836 |
| Thaps_hclust_0316 |
|
|
0.14 |
2.2 |
4.4 |
lowFe_TMEVA | 0.029700 | 0.824 |
| Title | Cluster Plot | Dendrogram | e-value | e-value | e-value | Condition | Condition FDR | Condition Difference |
|---|---|---|---|---|---|---|---|---|
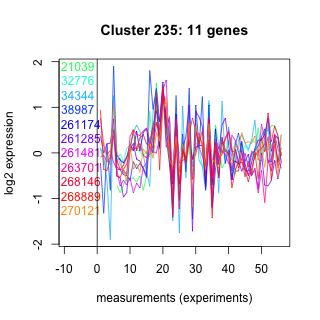
| Thaps_hclust_0235 |
 |
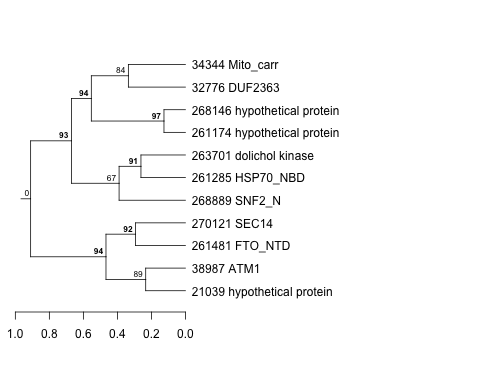 |
0.47 |
5.6 |
74 |
BaP | 0.004570 | 0.834 |
| Thaps_hclust_0235 |
|
|
0.47 |
5.6 |
74 |
lowtemp_TMEVA | 0.031000 | 0.771 |
| Title | Cluster Plot | Dendrogram | e-value | e-value | e-value | Condition | Condition FDR | Condition Difference |
|---|---|---|---|---|---|---|---|---|
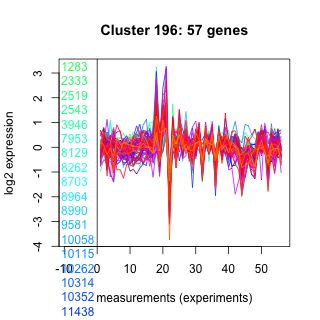
| Thaps_hclust_0196 |
 |
 |
0.0000000000000088 |
0.00000034 |
0.000017 |
BaP | 0.000370 | 0.834 |
| Title | Cluster Plot | Dendrogram | e-value | e-value | e-value | Condition | Condition FDR | Condition Difference |
|---|---|---|---|---|---|---|---|---|
| Thaps_hclust_0109 |
 |
 |
17 |
32 |
5.5 |
highpH_TMEVA | 0.000725 | 0.834 |
| Thaps_hclust_0109 |
|
|
17 |
32 |
5.5 |
BaP | 0.005110 | 0.764 |
| Title | Cluster Plot | Dendrogram | e-value | e-value | e-value | Condition | Condition FDR | Condition Difference |
|---|---|---|---|---|---|---|---|---|
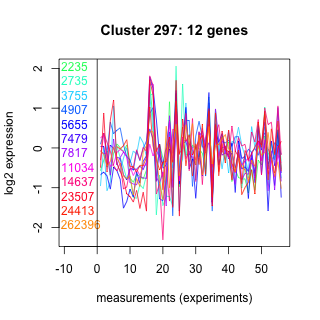
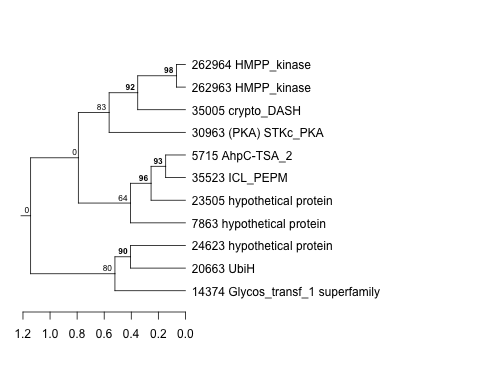
| Thaps_hclust_0297 |
 |
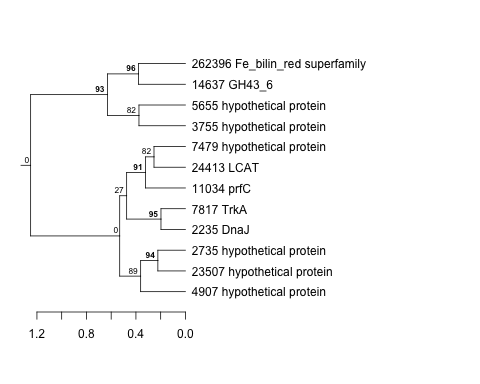 |
0.018 |
2.5 |
24 |
lowFe_KTKB_Day5 | 0.003410 | 0.832 |
| Title | Cluster Plot | Dendrogram | e-value | e-value | e-value | Condition | Condition FDR | Condition Difference |
|---|---|---|---|---|---|---|---|---|
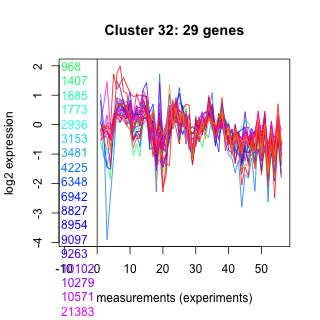
| Thaps_hclust_0032 |
 |
 |
1.3e-16 |
0.00000035 |
0.00012 |
exponential_vs_stationary_24light | 0.000581 | 0.831 |
| Title | Cluster Plot | Dendrogram | e-value | e-value | e-value | Condition | Condition FDR | Condition Difference |
|---|---|---|---|---|---|---|---|---|
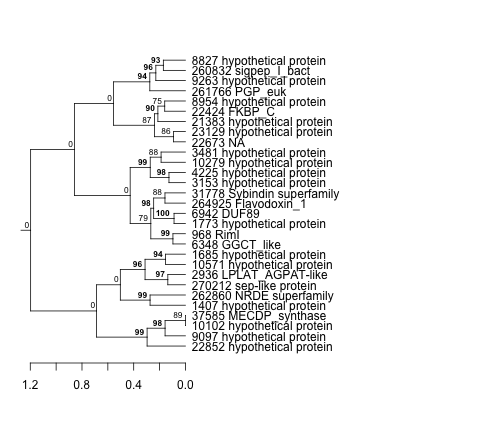
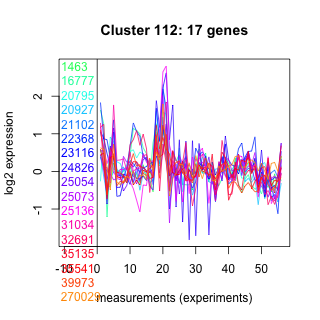
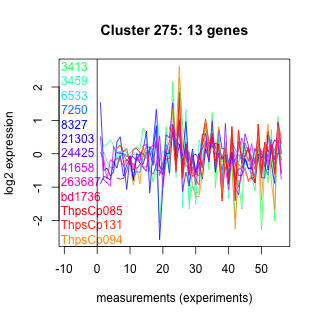
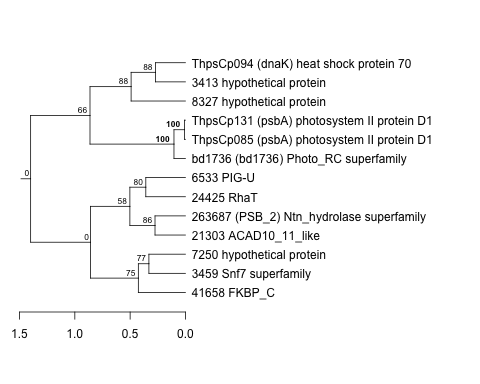
| Thaps_hclust_0112 |
 |
 |
0.00000035 |
0.017 |
0.34 |
highpH_TMEVA | 0.000725 | 0.831 |
| Title | Cluster Plot | Dendrogram | e-value | e-value | e-value | Condition | Condition FDR | Condition Difference |
|---|---|---|---|---|---|---|---|---|
| Thaps_hclust_0063 |
 |
 |
9.8e-19 |
5.7e-17 |
8.2e-17 |
co2_elevated_stat_arrays | 0.000658 | 0.831 |
| Thaps_hclust_0063 |
|
|
9.8e-19 |
5.7e-17 |
8.2e-17 |
exponential_vs_stationary_24light | 0.006670 | 0.772 |
| Title | Cluster Plot | Dendrogram | e-value | e-value | e-value | Condition | Condition FDR | Condition Difference |
|---|---|---|---|---|---|---|---|---|
| Thaps_hclust_0220 |
 |
|
|
2.4e-19 |
3.2e-19 |
BaP | 0.000370 | 0.829 |
| Title | Cluster Plot | Dendrogram | e-value | e-value | e-value | Condition | Condition FDR | Condition Difference |
|---|---|---|---|---|---|---|---|---|
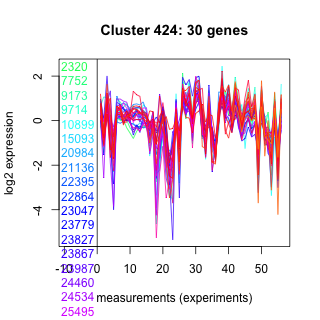
| Thaps_hclust_0424 |
 |
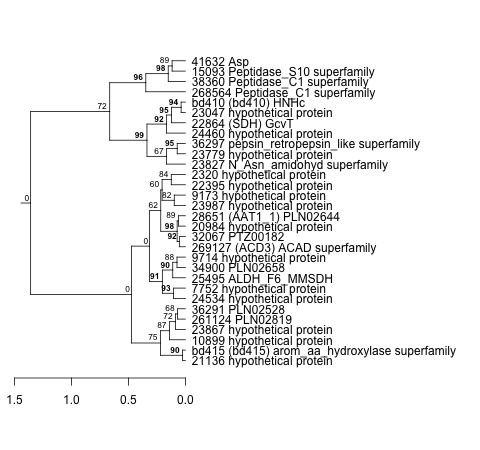 |
0.012 |
0.74 |
0.26 |
highlight_arrays | 0.000442 | 0.829 |
| Title | Cluster Plot | Dendrogram | e-value | e-value | e-value | Condition | Condition FDR | Condition Difference |
|---|---|---|---|---|---|---|---|---|
| Thaps_hclust_0051 |
 |
 |
0.012 |
0.033 |
0.41 |
BaP | 0.002470 | 0.828 |
| Title | Cluster Plot | Dendrogram | e-value | e-value | e-value | Condition | Condition FDR | Condition Difference |
|---|---|---|---|---|---|---|---|---|
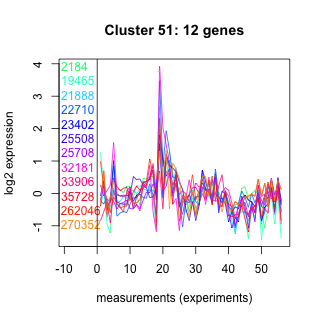
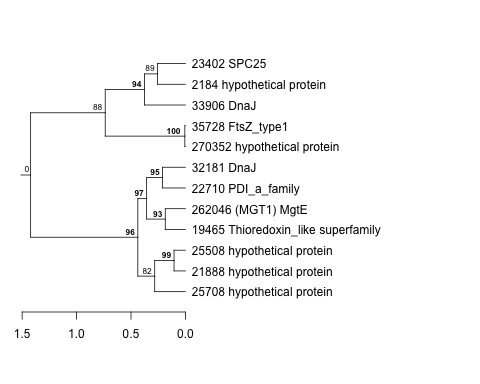
| Thaps_hclust_0229 |
 |
 |
9.9e-18 |
0.000000000000034 |
0.0000002 |
lowtemp_TMEVA | 0.000735 | 0.823 |
| Title | Cluster Plot | Dendrogram | e-value | e-value | e-value | Condition | Condition FDR | Condition Difference |
|---|---|---|---|---|---|---|---|---|
| Thaps_hclust_0047 |
 |
 |
3.4e-21 |
3.4e-17 |
5.5e-19 |
lowtemp_TMEVA | 0.000735 | 0.819 |
| Title | Cluster Plot | Dendrogram | e-value | e-value | e-value | Condition | Condition FDR | Condition Difference |
|---|---|---|---|---|---|---|---|---|
| Thaps_hclust_0101 |
 |
 |
0.000000016 |
0.0000038 |
0.014 |
exponential_vs_stationary_24light | 0.000581 | 0.819 |
| Title | Cluster Plot | Dendrogram | e-value | e-value | e-value | Condition | Condition FDR | Condition Difference |
|---|---|---|---|---|---|---|---|---|
| Thaps_hclust_0040 |
 |
 |
1.8e-29 |
0.000000000042 |
0.00000000063 |
co2_elevated_expo_arrays | 0.001390 | 0.817 |
| Title | Cluster Plot | Dendrogram | e-value | e-value | e-value | Condition | Condition FDR | Condition Difference |
|---|---|---|---|---|---|---|---|---|
| Thaps_hclust_0026 |
 |
 |
0.0021 |
0.16 |
0.32 |
diel_exponential_vs_stationary | 0.001110 | 0.813 |
| Thaps_hclust_0026 |
|
|
0.0021 |
0.16 |
0.32 |
exponential_vs_stationary_24light | 0.059500 | 0.757 |
| Title | Cluster Plot | Dendrogram | e-value | e-value | e-value | Condition | Condition FDR | Condition Difference |
|---|---|---|---|---|---|---|---|---|
| Thaps_hclust_0296 |
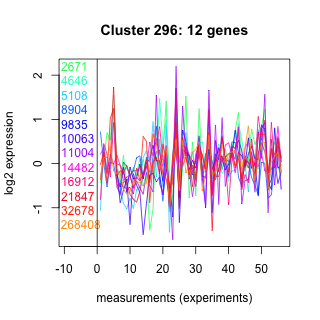 |
 |
0.17 |
1.8 |
0.83 |
lowtemp_TMEVA | 0.023500 | 0.813 |
| Title | Cluster Plot | Dendrogram | e-value | e-value | e-value | Condition | Condition FDR | Condition Difference |
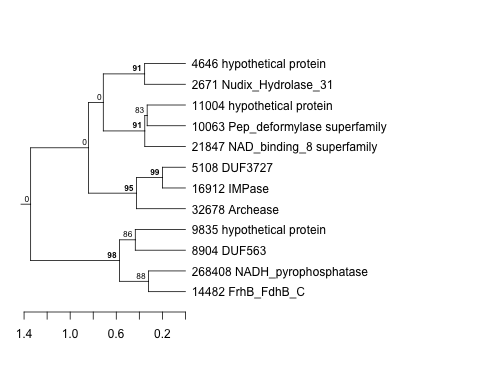
|---|---|---|---|---|---|---|---|---|
| Thaps_hclust_0206 |
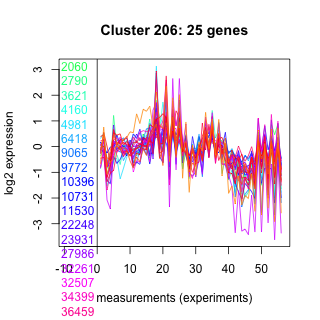 |
 |
0.00000000000075 |
0.0000028 |
3.5 |
BaP | 0.000370 | 0.811 |
| Title | Cluster Plot | Dendrogram | e-value | e-value | e-value | Condition | Condition FDR | Condition Difference |
|---|---|---|---|---|---|---|---|---|
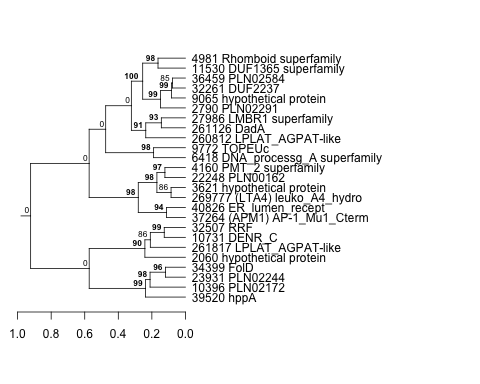
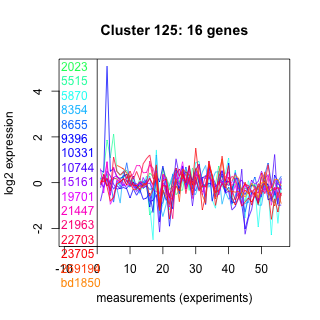
| Thaps_hclust_0125 |
 |
 |
0.1 |
0.35 |
2.4 |
lowN_TMEVA | 0.019200 | 0.809 |
| Title | Cluster Plot | Dendrogram | e-value | e-value | e-value | Condition | Condition FDR | Condition Difference |
|---|---|---|---|---|---|---|---|---|
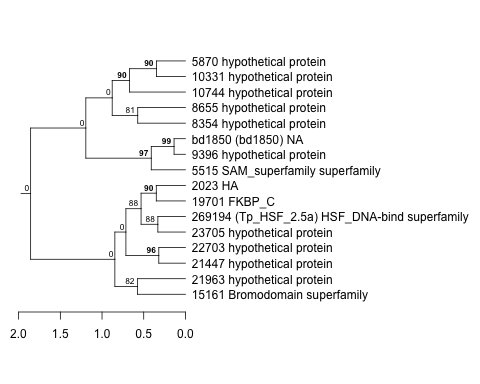
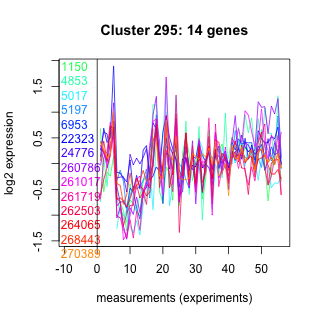
| Thaps_hclust_0295 |
 |
 |
0.0000053 |
0.00095 |
0.0005 |
lowtemp_TMEVA | 0.012000 | 0.803 |
| Title | Cluster Plot | Dendrogram | e-value | e-value | e-value | Condition | Condition FDR | Condition Difference |
|---|---|---|---|---|---|---|---|---|
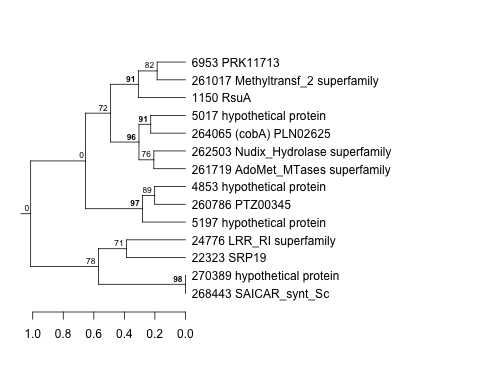
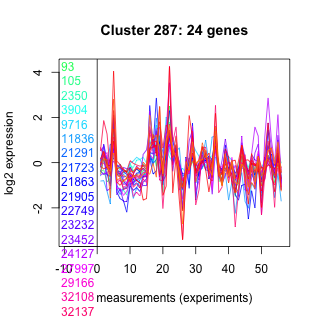
| Thaps_hclust_0287 |
 |
 |
0.0000001 |
0.00007 |
0.003 |
lowFe_KTKB_Day3 | 0.000862 | 0.802 |
| Title | Cluster Plot | Dendrogram | e-value | e-value | e-value | Condition | Condition FDR | Condition Difference |
|---|---|---|---|---|---|---|---|---|
| Thaps_hclust_0496 |
 |
 |
0.00082 |
0.0031 |
0.43 |
diel_exponential_vs_stationary | 0.000602 | 0.802 |
| Title | Cluster Plot | Dendrogram | e-value | e-value | e-value | Condition | Condition FDR | Condition Difference |
|---|---|---|---|---|---|---|---|---|
| Thaps_hclust_0336 |
 |
 |
8.7e-23 |
0.00000000000015 |
0.0000000000000032 |
co2_elevated_stat_arrays | 0.001700 | 0.801 |
| Title | Cluster Plot | Dendrogram | e-value | e-value | e-value | Condition | Condition FDR | Condition Difference |
|---|---|---|---|---|---|---|---|---|
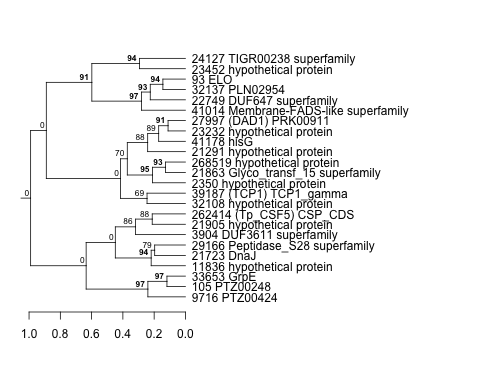
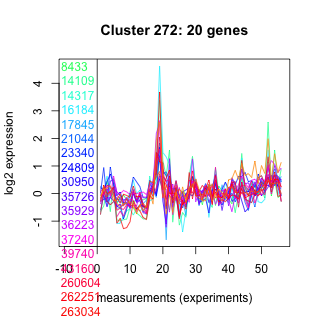
| Thaps_hclust_0272 |
 |
 |
0.0048 |
0.01 |
0.059 |
BaP | 0.000709 | 0.798 |
| Title | Cluster Plot | Dendrogram | e-value | e-value | e-value | Condition | Condition FDR | Condition Difference |
|---|---|---|---|---|---|---|---|---|
| Thaps_hclust_0227 |
 |
 |
1.2e-22 |
0.0000000098 |
0.0018 |
BaP | 0.000370 | 0.798 |
| Title | Cluster Plot | Dendrogram | e-value | e-value | e-value | Condition | Condition FDR | Condition Difference |
|---|---|---|---|---|---|---|---|---|
| Thaps_hclust_0122 |
 |
 |
0.0000037 |
0.061 |
0.0018 |
BaP | 0.000370 | 0.798 |
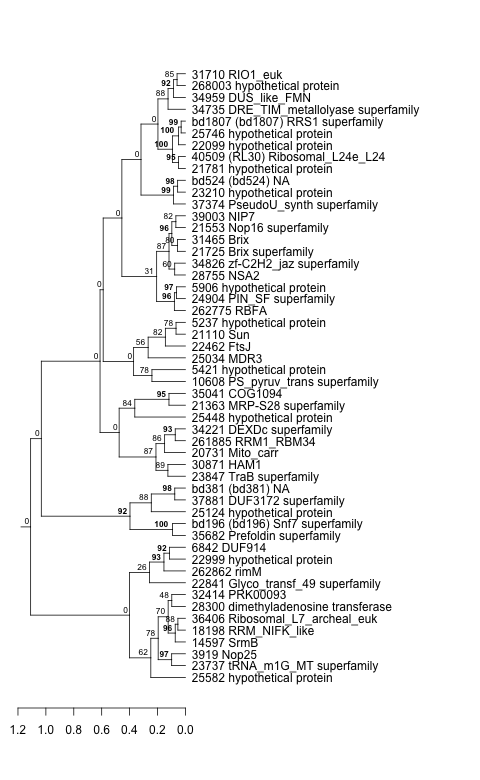
| Title | Cluster Plot | Dendrogram | e-value | e-value | e-value | Condition | Condition FDR | Condition Difference |
|---|---|---|---|---|---|---|---|---|
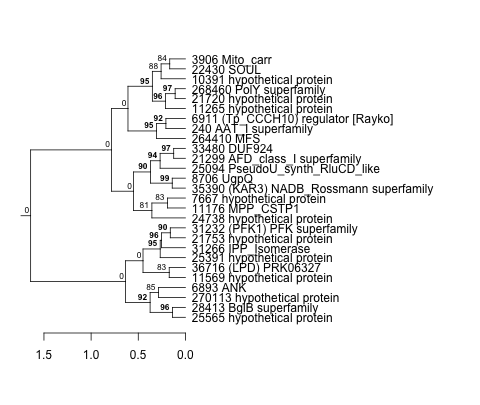
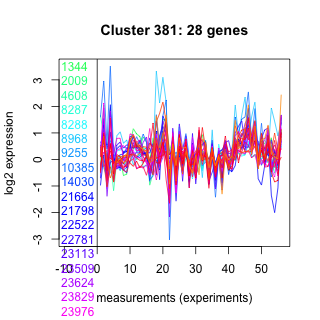
| Thaps_hclust_0381 |
 |
 |
0.0001 |
0.0035 |
0.061 |
lowSi_TMEVA | 0.011600 | 0.797 |
| Title | Cluster Plot | Dendrogram | e-value | e-value | e-value | Condition | Condition FDR | Condition Difference |
|---|---|---|---|---|---|---|---|---|
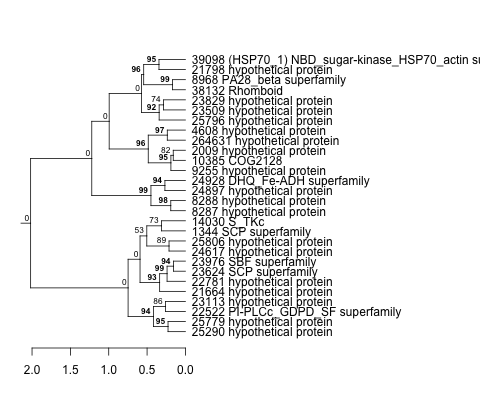
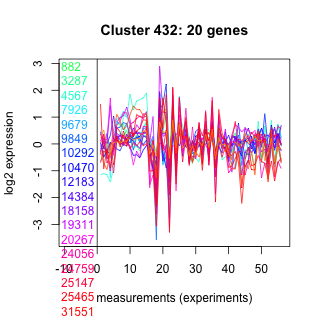
| Thaps_hclust_0432 |
 |
 |
0.011 |
0.06 |
2.4 |
diel_light_vs_dark | 0.000485 | 0.797 |
| Title | Cluster Plot | Dendrogram | e-value | e-value | e-value | Condition | Condition FDR | Condition Difference |
|---|---|---|---|---|---|---|---|---|
| Thaps_hclust_0097 |
 |
 |
0.02 |
1.4 |
3.4 |
co2_elevated_expo_arrays | 0.001390 | 0.796 |
| Title | Cluster Plot | Dendrogram | e-value | e-value | e-value | Condition | Condition FDR | Condition Difference |
|---|---|---|---|---|---|---|---|---|
| Thaps_hclust_0038 |
 |
 |
0.0016 |
0.024 |
17 |
lowN_TMEVA | 0.056600 | 0.794 |
| Title | Cluster Plot | Dendrogram | e-value | e-value | e-value | Condition | Condition FDR | Condition Difference |
|---|---|---|---|---|---|---|---|---|
| Thaps_hclust_0116 |
 |
 |
0.74 |
8.1 |
4.9 |
highlight_arrays | 0.000442 | 0.791 |
| Title | Cluster Plot | Dendrogram | e-value | e-value | e-value | Condition | Condition FDR | Condition Difference |
|---|---|---|---|---|---|---|---|---|
| Thaps_hclust_0117 |
 |
 |
0.0000000000002 |
0.000000021 |
0.00000045 |
co2_elevated_expo_arrays | 0.001390 | 0.788 |
| Title | Cluster Plot | Dendrogram | e-value | e-value | e-value | Condition | Condition FDR | Condition Difference |
|---|---|---|---|---|---|---|---|---|
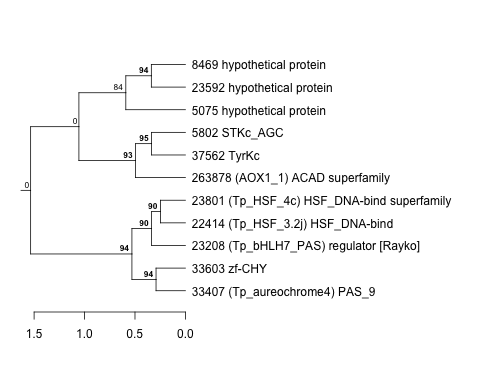
| Thaps_hclust_0318 |
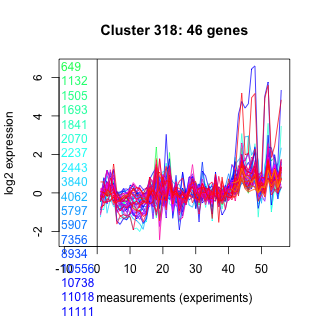 |
 |
1.1e-17 |
0.000000015 |
0.0000081 |
co2_elevated_stat_arrays | 0.000658 | 0.784 |
| Title | Cluster Plot | Dendrogram | e-value | e-value | e-value | Condition | Condition FDR | Condition Difference |
|---|---|---|---|---|---|---|---|---|
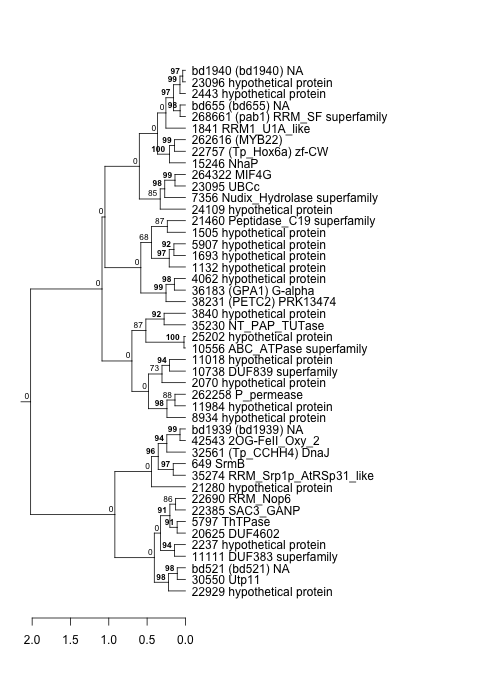
| Thaps_hclust_0224 |
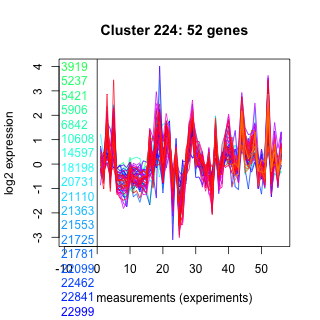 |
 |
9.3e-28 |
1.9e-21 |
0.046 |
BaP | 0.000370 | 0.783 |
| Title | Cluster Plot | Dendrogram | e-value | e-value | e-value | Condition | Condition FDR | Condition Difference |
|---|---|---|---|---|---|---|---|---|
| Thaps_hclust_0418 |
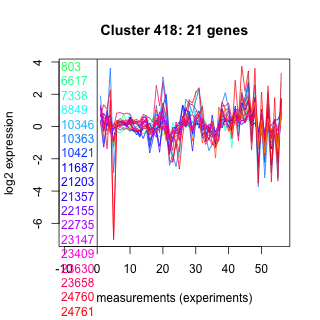 |
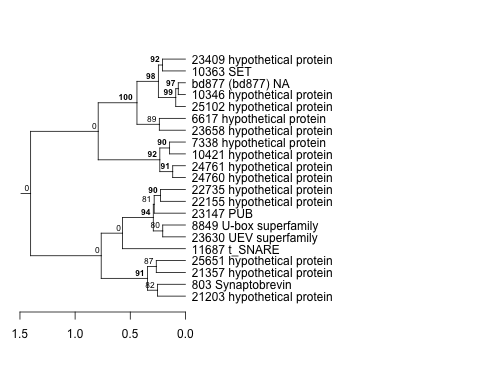 |
0.00074 |
0.0098 |
0.29 |
highpH_TMEVA | 0.000725 | 0.78 |
| Title | Cluster Plot | Dendrogram | e-value | e-value | e-value | Condition | Condition FDR | Condition Difference |
|---|---|---|---|---|---|---|---|---|
| Thaps_hclust_0483 |
 |
 |
0.7 |
5 |
0.096 |
highlight_arrays | 0.000442 | 0.78 |
| Title | Cluster Plot | Dendrogram | e-value | e-value | e-value | Condition | Condition FDR | Condition Difference |
|---|---|---|---|---|---|---|---|---|
| Thaps_hclust_0354 |
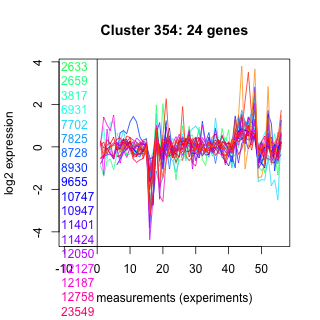 |
 |
0.027 |
0.032 |
0.78 |
highlight_arrays | 0.000442 | 0.779 |
| Title | Cluster Plot | Dendrogram | e-value | e-value | e-value | Condition | Condition FDR | Condition Difference |
|---|---|---|---|---|---|---|---|---|
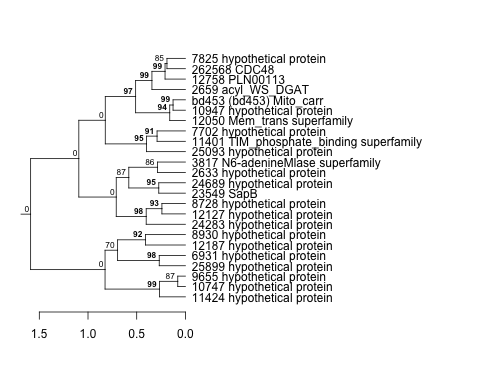
| Thaps_hclust_0244 |
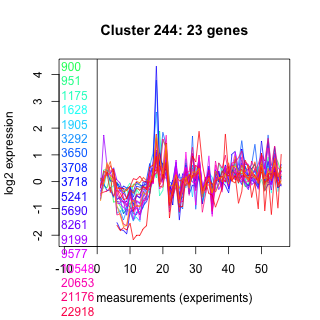 |
 |
0.000000057 |
0.0001 |
4.1 |
BaP | 0.000370 | 0.779 |
| Title | Cluster Plot | Dendrogram | e-value | e-value | e-value | Condition | Condition FDR | Condition Difference |
|---|---|---|---|---|---|---|---|---|
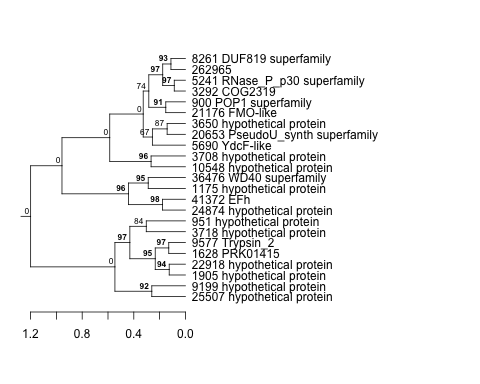
| Thaps_hclust_0392 |
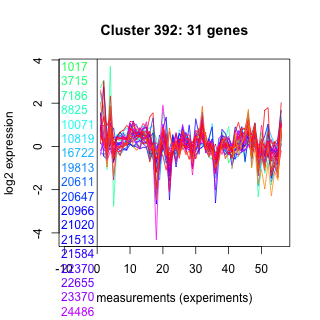 |
 |
0.00055 |
0.0027 |
0.19 |
lowSi_TMEVA | 0.010400 | 0.778 |
| Thaps_hclust_0392 |
|
|
0.00055 |
0.0027 |
0.19 |
lowFe_TMEVA | 0.001040 | 0.737 |
| Title | Cluster Plot | Dendrogram | e-value | e-value | e-value | Condition | Condition FDR | Condition Difference |
|---|---|---|---|---|---|---|---|---|
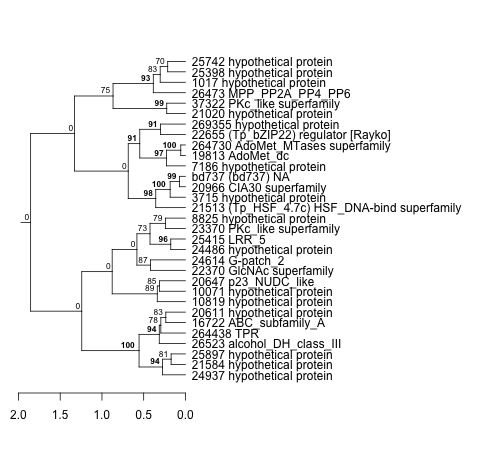
| Thaps_hclust_0217 |
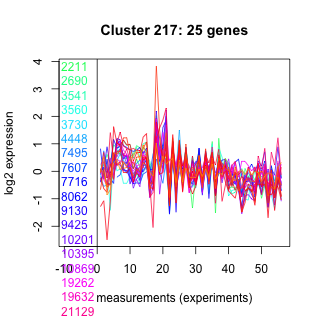 |
 |
0.00000028 |
0.95 |
9.7 |
diel_light_vs_dark | 0.000485 | 0.777 |
| Title | Cluster Plot | Dendrogram | e-value | e-value | e-value | Condition | Condition FDR | Condition Difference |
|---|---|---|---|---|---|---|---|---|
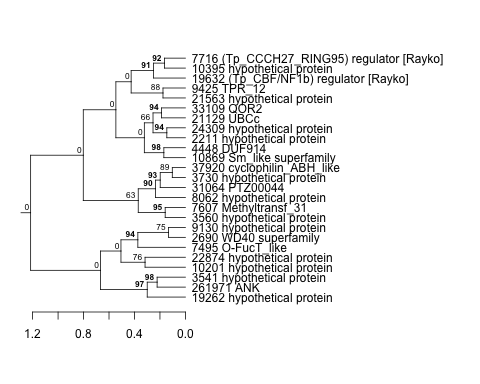
| Thaps_hclust_0276 |
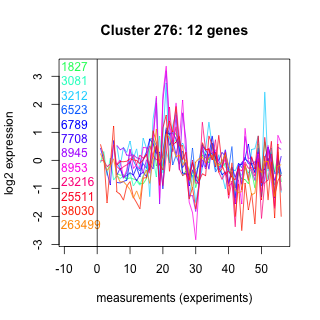 |
 |
0.063 |
39 |
53 |
exponential_vs_stationary_24light | 0.044000 | 0.777 |
| Title | Cluster Plot | Dendrogram | e-value | e-value | e-value | Condition | Condition FDR | Condition Difference |
|---|---|---|---|---|---|---|---|---|
| Thaps_hclust_0027 |
 |
 |
0.0000000084 |
0.0086 |
0.069 |
diel_exponential_vs_stationary | 0.000602 | 0.775 |
| Title | Cluster Plot | Dendrogram | e-value | e-value | e-value | Condition | Condition FDR | Condition Difference |
|---|---|---|---|---|---|---|---|---|
| Thaps_hclust_0238 |
 |
 |
0.0018 |
0.095 |
0.069 |
BaP | 0.000709 | 0.775 |
| Title | Cluster Plot | Dendrogram | e-value | e-value | e-value | Condition | Condition FDR | Condition Difference |
|---|---|---|---|---|---|---|---|---|
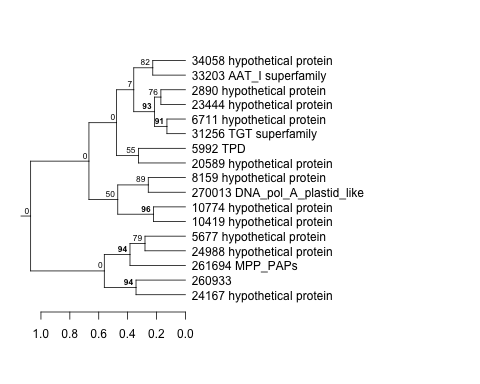
| Thaps_hclust_0231 |
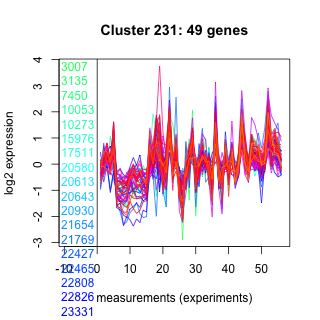 |
 |
9.5e-23 |
0.000000000000034 |
0.00000039 |
co2_elevated_stat_arrays | 0.000658 | 0.774 |
| Title | Cluster Plot | Dendrogram | e-value | e-value | e-value | Condition | Condition FDR | Condition Difference |
|---|---|---|---|---|---|---|---|---|
| Thaps_hclust_0360 |
 |
 |
0.0000000013 |
0.0000000052 |
0.0000016 |
lowFe_KTKB_Day3 | 0.000862 | 0.774 |
| Title | Cluster Plot | Dendrogram | e-value | e-value | e-value | Condition | Condition FDR | Condition Difference |
|---|---|---|---|---|---|---|---|---|
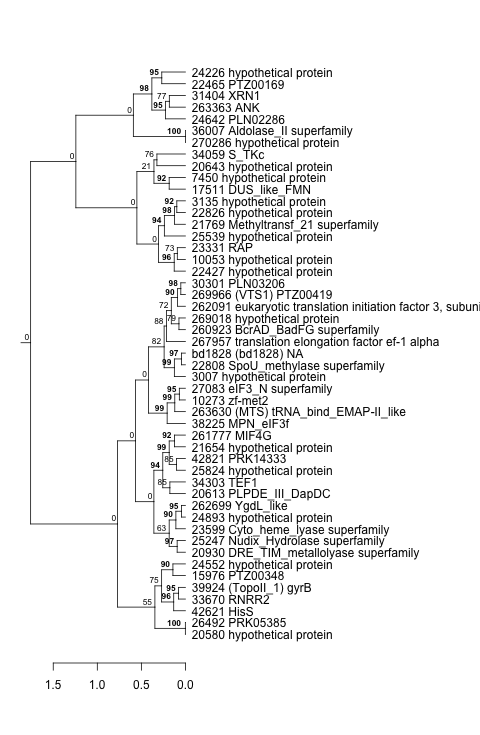
| Thaps_hclust_0090 |
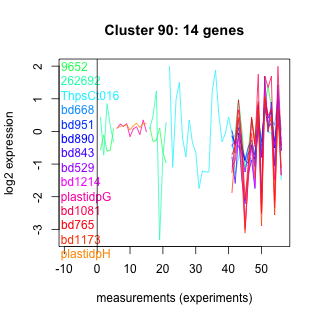 |
 |
0.23 |
2.7 |
11 |
co2_elevated_expo_arrays | 0.001390 | 0.773 |
| Title | Cluster Plot | Dendrogram | e-value | e-value | e-value | Condition | Condition FDR | Condition Difference |
|---|---|---|---|---|---|---|---|---|
| Thaps_hclust_0017 |
 |
 |
4.6e-24 |
0.00000000000046 |
0.000000000000098 |
lowFe_KTKB_Day5 | 0.001320 | 0.772 |
| Title | Cluster Plot | Dendrogram | e-value | e-value | e-value | Condition | Condition FDR | Condition Difference |
|---|---|---|---|---|---|---|---|---|
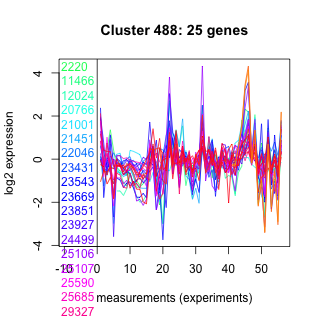
| Thaps_hclust_0488 |
 |
 |
0.15 |
0.012 |
0.2 |
highpH_TMEVA | 0.000725 | 0.768 |
| Title | Cluster Plot | Dendrogram | e-value | e-value | e-value | Condition | Condition FDR | Condition Difference |
|---|---|---|---|---|---|---|---|---|
| Thaps_hclust_0329 |
 |
 |
0.0000000004 |
0.00000034 |
0.000023 |
highlight_arrays | 0.000442 | 0.768 |
| Title | Cluster Plot | Dendrogram | e-value | e-value | e-value | Condition | Condition FDR | Condition Difference |
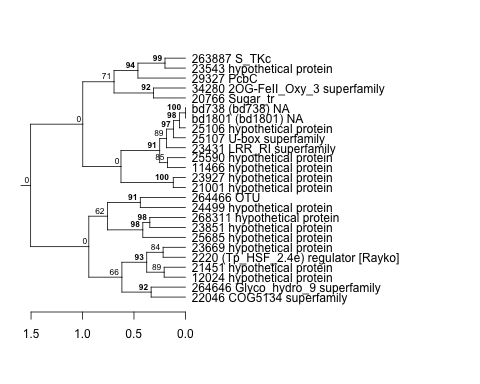
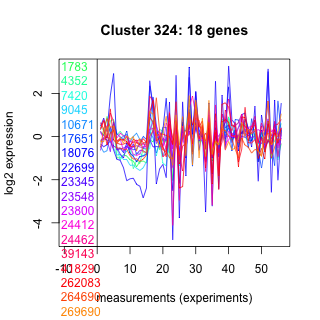
|---|---|---|---|---|---|---|---|---|
| Thaps_hclust_0324 |
 |
 |
0.0023 |
2.4 |
5.1 |
lowFe_KTKB_Day5 | 0.001320 | 0.767 |
| Title | Cluster Plot | Dendrogram | e-value | e-value | e-value | Condition | Condition FDR | Condition Difference |
|---|---|---|---|---|---|---|---|---|
| Thaps_hclust_0054 |
 |
 |
1.6e-17 |
0.0000000000053 |
0.000000000000024 |
lowFe_KTKB_Day3 | 0.001610 | 0.767 |
| Title | Cluster Plot | Dendrogram | e-value | e-value | e-value | Condition | Condition FDR | Condition Difference |
|---|---|---|---|---|---|---|---|---|
| Thaps_hclust_0327 |
 |
 |
0.0000000037 |
0.013 |
3.8 |
lowN_TMEVA | 0.003130 | 0.767 |
| Title | Cluster Plot | Dendrogram | e-value | e-value | e-value | Condition | Condition FDR | Condition Difference |
|---|---|---|---|---|---|---|---|---|
| Thaps_hclust_0072 |
 |
 |
1.2e-22 |
1.1e-16 |
0.000000000000011 |
lowN_TMEVA | 0.120000 | 0.766 |
| Title | Cluster Plot | Dendrogram | e-value | e-value | e-value | Condition | Condition FDR | Condition Difference |
|---|---|---|---|---|---|---|---|---|
| Thaps_hclust_0356 |
 |
 |
2.1 |
41 |
71 |
BaP | 0.024900 | 0.763 |
| Title | Cluster Plot | Dendrogram | e-value | e-value | e-value | Condition | Condition FDR | Condition Difference |
|---|---|---|---|---|---|---|---|---|
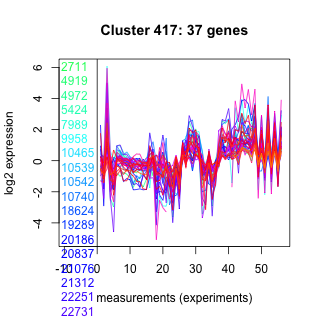
| Thaps_hclust_0417 |
 |
 |
0.0000000018 |
0.00013 |
0.00029 |
highlight_arrays | 0.000442 | 0.762 |
| Title | Cluster Plot | Dendrogram | e-value | e-value | e-value | Condition | Condition FDR | Condition Difference |
|---|---|---|---|---|---|---|---|---|
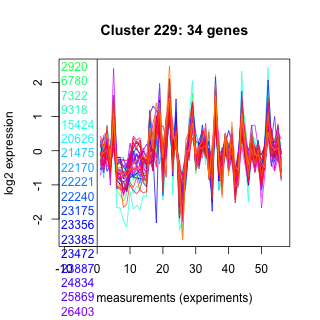
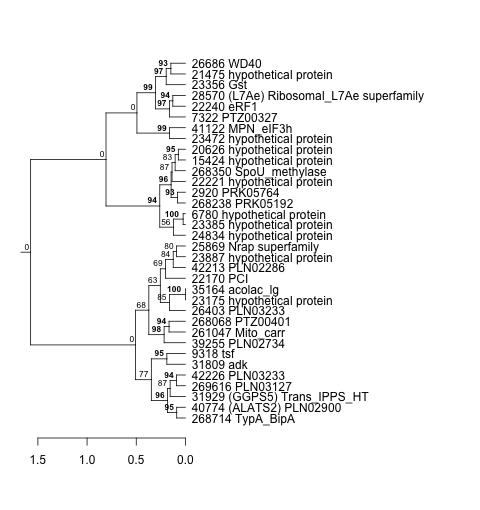
| Thaps_hclust_0221 |
 |
|
|
1e-37 |
0.0000000000012 |
BaP | 0.000370 | 0.761 |
| Title | Cluster Plot | Dendrogram | e-value | e-value | e-value | Condition | Condition FDR | Condition Difference |
|---|---|---|---|---|---|---|---|---|
| Thaps_hclust_0043 |
 |
 |
3.9e-18 |
0.0000000053 |
2 |
lowtemp_TMEVA | 0.000735 | 0.76 |
| Title | Cluster Plot | Dendrogram | e-value | e-value | e-value | Condition | Condition FDR | Condition Difference |
|---|---|---|---|---|---|---|---|---|
| Thaps_hclust_0305 |
 |
 |
0.66 |
3.2 |
6.5 |
highlight_arrays | 0.000442 | 0.758 |
| Title | Cluster Plot | Dendrogram | e-value | e-value | e-value | Condition | Condition FDR | Condition Difference |
|---|---|---|---|---|---|---|---|---|
| Thaps_hclust_0497 |
 |
 |
0.1 |
5.2 |
29 |
highpH_TMEVA | 0.003090 | 0.756 |
| Title | Cluster Plot | Dendrogram | e-value | e-value | e-value | Condition | Condition FDR | Condition Difference |
|---|---|---|---|---|---|---|---|---|
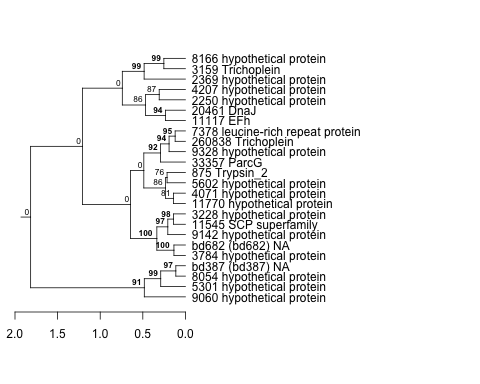
| Thaps_hclust_0386 |
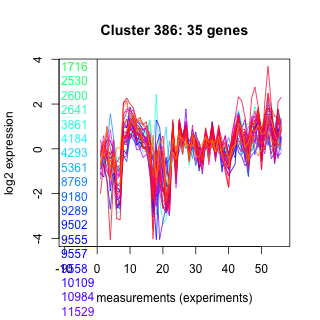 |
 |
0.00000064 |
0.00000005 |
0.00054 |
diel_light_vs_dark | 0.000485 | 0.755 |
| Title | Cluster Plot | Dendrogram | e-value | e-value | e-value | Condition | Condition FDR | Condition Difference |
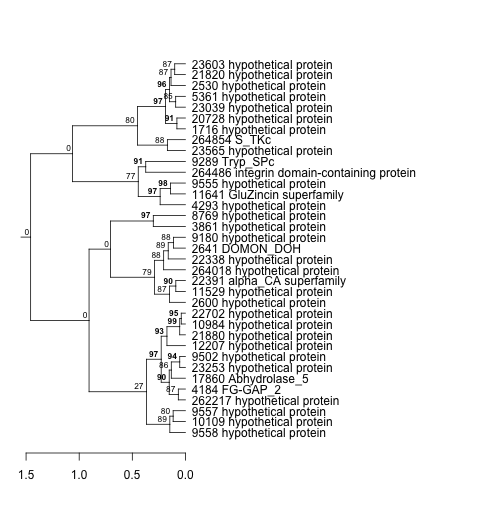
|---|---|---|---|---|---|---|---|---|
| Thaps_hclust_0211 |
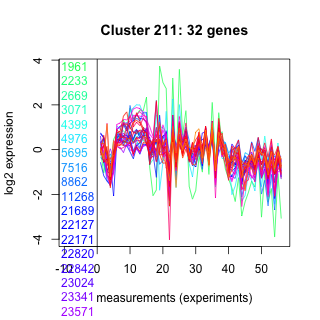 |
 |
0.000000055 |
0.00014 |
0.026 |
exponential_vs_stationary_24light | 0.000581 | 0.755 |
| Title | Cluster Plot | Dendrogram | e-value | e-value | e-value | Condition | Condition FDR | Condition Difference |
|---|---|---|---|---|---|---|---|---|
| Thaps_hclust_0378 |
 |
 |
0.0003 |
210 |
10 |
diel_light_vs_dark | 0.001770 | 0.752 |
| Title | Cluster Plot | Dendrogram | e-value | e-value | e-value | Condition | Condition FDR | Condition Difference |
|---|---|---|---|---|---|---|---|---|
| Thaps_hclust_0245 |
 |
 |
0.52 |
100 |
150 |
lowFe_TMEVA | 0.027700 | 0.752 |
| Title | Cluster Plot | Dendrogram | e-value | e-value | e-value | Condition | Condition FDR | Condition Difference |
|---|---|---|---|---|---|---|---|---|
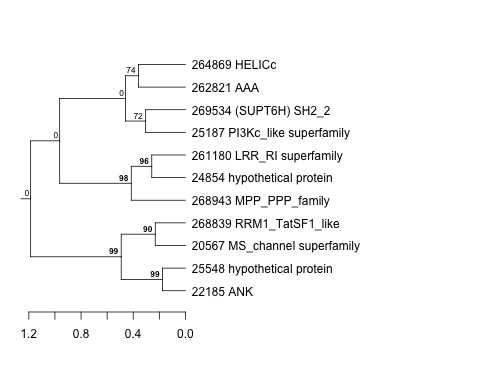
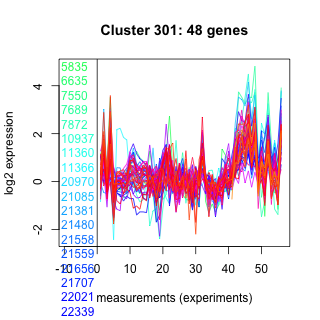
| Thaps_hclust_0301 |
 |
 |
0.000000022 |
0.82 |
2.1 |
co2_elevated_stat_arrays | 0.000658 | 0.748 |
| Thaps_hclust_0301 |
|
|
0.000000022 |
0.82 |
2.1 |
highlight_arrays | 0.000442 | 0.74 |
| Title | Cluster Plot | Dendrogram | e-value | e-value | e-value | Condition | Condition FDR | Condition Difference |
|---|---|---|---|---|---|---|---|---|
| Thaps_hclust_0210 |
 |
 |
0.0000000000046 |
0.0000033 |
0.086 |
exponential_vs_stationary_24highlight | 0.000526 | 0.747 |
| Thaps_hclust_0210 |
|
|
0.0000000000046 |
0.0000033 |
0.086 |
diel_exponential_vs_stationary | 0.000602 | 0.741 |
| Title | Cluster Plot | Dendrogram | e-value | e-value | e-value | Condition | Condition FDR | Condition Difference |
|---|---|---|---|---|---|---|---|---|
| Thaps_hclust_0319 |
 |
 |
2.4 |
46 |
70 |
lowtemp_TMEVA | 0.065900 | 0.744 |
| Title | Cluster Plot | Dendrogram | e-value | e-value | e-value | Condition | Condition FDR | Condition Difference |
|---|---|---|---|---|---|---|---|---|
| Thaps_hclust_0219 |
 |
 |
2.8e-16 |
0.0000000055 |
0.012 |
lowtemp_TMEVA | 0.000735 | 0.742 |
| Title | Cluster Plot | Dendrogram | e-value | e-value | e-value | Condition | Condition FDR | Condition Difference |
|---|---|---|---|---|---|---|---|---|
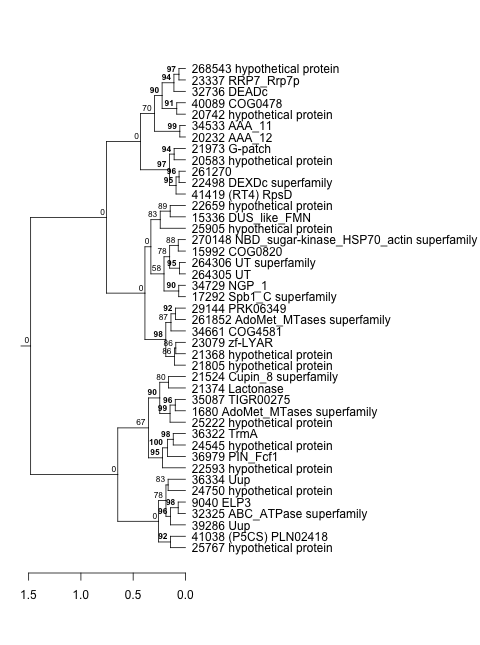
| Thaps_hclust_0441 |
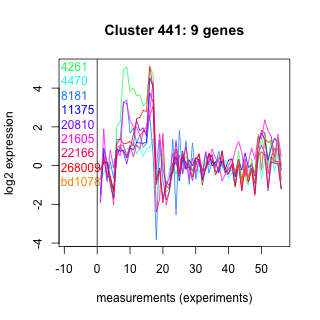 |
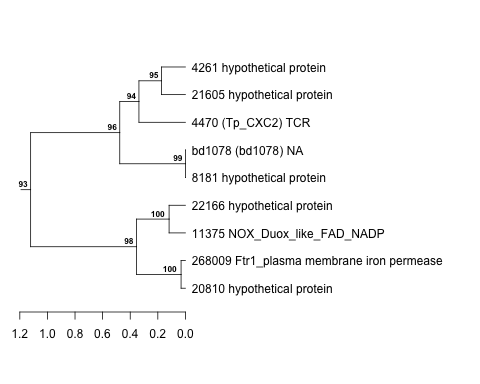 |
0.00081 |
0.001 |
0.0015 |
exponential_vs_stationary_24highlight | 0.000526 | 0.741 |
| Title | Cluster Plot | Dendrogram | e-value | e-value | e-value | Condition | Condition FDR | Condition Difference |
|---|---|---|---|---|---|---|---|---|
| Thaps_hclust_0315 |
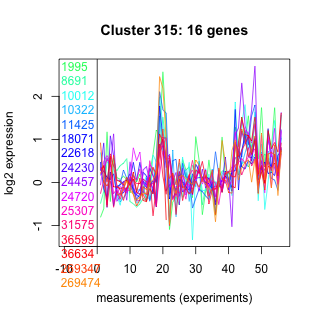 |
 |
0.01 |
0.93 |
0.53 |
BaP | 0.001030 | 0.741 |
| Title | Cluster Plot | Dendrogram | e-value | e-value | e-value | Condition | Condition FDR | Condition Difference |
|---|---|---|---|---|---|---|---|---|
| Thaps_hclust_0174 |
 |
 |
1.3 |
0.99 |
2.2 |
exponential_vs_stationary_24light | 0.003090 | 0.738 |
| Title | Cluster Plot | Dendrogram | e-value | e-value | e-value | Condition | Condition FDR | Condition Difference |
|---|---|---|---|---|---|---|---|---|
| Thaps_hclust_0209 |
 |
 |
1.2e-16 |
0.00011 |
0.000027 |
diel_light_vs_dark | 0.000485 | 0.738 |
| Title | Cluster Plot | Dendrogram | e-value | e-value | e-value | Condition | Condition FDR | Condition Difference |
|---|---|---|---|---|---|---|---|---|
| Thaps_hclust_0362 |
 |
 |
0.00003 |
0.0033 |
0.66 |
co2_elevated_stat_arrays | 0.000658 | 0.737 |
| Title | Cluster Plot | Dendrogram | e-value | e-value | e-value | Condition | Condition FDR | Condition Difference |
|---|---|---|---|---|---|---|---|---|
| Thaps_hclust_0126 |
 |
 |
0.025 |
1.3 |
0.6 |
diel_light_vs_dark | 0.000485 | 0.732 |
| Title | Cluster Plot | Dendrogram | e-value | e-value | e-value | Condition | Condition FDR | Condition Difference |
|---|---|---|---|---|---|---|---|---|
| Thaps_hclust_0282 |
 |
 |
0.0005 |
0.0059 |
0.15 |
co2_elevated_stat_arrays | 0.000658 | 0.732 |
| Title | Cluster Plot | Dendrogram | e-value | e-value | e-value | Condition | Condition FDR | Condition Difference |
|---|---|---|---|---|---|---|---|---|
| Thaps_hclust_0240 |
 |
 |
0.000000064 |
0.000021 |
0.00078 |
lowtemp_TMEVA | 0.000735 | 0.731 |
| Title | Cluster Plot | Dendrogram | e-value | e-value | e-value | Condition | Condition FDR | Condition Difference |
|---|---|---|---|---|---|---|---|---|
| Thaps_hclust_0176 |
 |
 |
29 |
59 |
110 |
exponential_vs_stationary_24light | 0.069700 | 0.731 |
| Title | Cluster Plot | Dendrogram | e-value | e-value | e-value | Condition | Condition FDR | Condition Difference |
|---|---|---|---|---|---|---|---|---|
| Thaps_hclust_0498 |
 |
 |
1.3 |
1.8 |
1.8 |
highlight_arrays | 0.000442 | 0.73 |
| Title | Cluster Plot | Dendrogram | e-value | e-value | e-value | Condition | Condition FDR | Condition Difference |
|---|---|---|---|---|---|---|---|---|
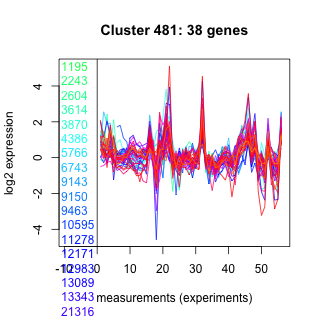
| Thaps_hclust_0481 |
 |
 |
0.000000069 |
0.00000053 |
0.000012 |
highpH_TMEVA | 0.000725 | 0.729 |
| Title | Cluster Plot | Dendrogram | e-value | e-value | e-value | Condition | Condition FDR | Condition Difference |
|---|---|---|---|---|---|---|---|---|
| Thaps_hclust_0390 |
 |
 |
0.013 |
0.066 |
0.15 |
diel_light_vs_dark | 0.016000 | 0.728 |
| Title | Cluster Plot | Dendrogram | e-value | e-value | e-value | Condition | Condition FDR | Condition Difference |
|---|---|---|---|---|---|---|---|---|
| Thaps_hclust_0066 |
 |
 |
0.0000000000000019 |
0.00000025 |
0.00000047 |
diel_exponential_vs_stationary | 0.000602 | 0.728 |
| Title | Cluster Plot | Dendrogram | e-value | e-value | e-value | Condition | Condition FDR | Condition Difference |
|---|---|---|---|---|---|---|---|---|
| Thaps_hclust_0039 |
 |
 |
2.2e-16 |
0.000000000000049 |
0.00083 |
lowtemp_TMEVA | 0.000735 | 0.728 |
| Title | Cluster Plot | Dendrogram | e-value | e-value | e-value | Condition | Condition FDR | Condition Difference |
|---|---|---|---|---|---|---|---|---|
| Thaps_hclust_0021 |
 |
 |
0.00000000002 |
0.0000088 |
0.0012 |
exponential_vs_stationary_24light | 0.000581 | 0.728 |
| Title | Cluster Plot | Dendrogram | e-value | e-value | e-value | Condition | Condition FDR | Condition Difference |
|---|---|---|---|---|---|---|---|---|
| Thaps_hclust_0082 |
 |
|
8.89825e-43 |
2e-27 |
1.3e-16 |
lowFe_KTKB_Day5 | 0.001320 | 0.728 |
| Title | Cluster Plot | Dendrogram | e-value | e-value | e-value | Condition | Condition FDR | Condition Difference |
|---|---|---|---|---|---|---|---|---|
| Thaps_hclust_0444 |
 |
 |
14 |
140 |
1.6 |
lowSi_TMEVA | 0.071500 | 0.728 |
| Title | Cluster Plot | Dendrogram | e-value | e-value | e-value | Condition | Condition FDR | Condition Difference |
|---|---|---|---|---|---|---|---|---|
| Thaps_hclust_0016 |
 |
 |
0.000000000083 |
0.00000025 |
0.00000028 |
diel_exponential_vs_stationary | 0.000602 | 0.727 |
| Title | Cluster Plot | Dendrogram | e-value | e-value | e-value | Condition | Condition FDR | Condition Difference |
|---|---|---|---|---|---|---|---|---|
| Thaps_hclust_0275 |
 |
 |
Not available | Not available | Not available | diel_light_vs_dark | 0.003420 | 0.727 |
| Title | Cluster Plot | Dendrogram | e-value | e-value | e-value | Condition | Condition FDR | Condition Difference |
|---|---|---|---|---|---|---|---|---|
| Thaps_hclust_0111 |
 |
 |
0.00032 |
0.0074 |
0.8 |
BaP | 0.001320 | 0.726 |
| Title | Cluster Plot | Dendrogram | e-value | e-value | e-value | Condition | Condition FDR | Condition Difference |
|---|---|---|---|---|---|---|---|---|
| Thaps_hclust_0001 |
 |
 |
0.0033 |
0.052 |
2 |
lowFe_KTKB_Day5 | 0.001320 | 0.726 |
| Title | Cluster Plot | Dendrogram | e-value | e-value | e-value | Condition | Condition FDR | Condition Difference |
|---|---|---|---|---|---|---|---|---|
| Thaps_hclust_0060 |
 |
 |
0.00000047 |
0.00077 |
0.0075 |
lowtemp_TMEVA | 0.000735 | 0.726 |